Assessing Tesla's Performance Against Competitors In Automobiles Industry
Author: Benzinga Insights | March 18, 2024 12:00pm
In today's fast-paced and competitive business landscape, it is essential for investors and industry enthusiasts to thoroughly analyze companies before making investment decisions. In this article, we will conduct a comprehensive industry comparison, evaluating Tesla (NASDAQ:TSLA) against its key competitors in the Automobiles industry. By examining key financial metrics, market position, and growth prospects, we aim to provide valuable insights for investors and shed light on company's performance within the industry.
Tesla Background
Founded in 2003 and based in Palo Alto, California, Tesla is a vertically integrated sustainable energy company that also aims to transition the world to electric mobility by making electric vehicles. The company sells solar panels and solar roofs for energy generation plus batteries for stationary storage for residential and commercial properties including utilities. Tesla has multiple vehicles in its fleet, which include luxury and midsize sedans and crossover SUVs. The company also plans to begin selling more affordable sedans and small SUVs, a light truck, a semi truck, and a sports car. Global deliveries in 2023 were a little over 1.8 million vehicles.
| Company |
P/E |
P/B |
P/S |
ROE |
EBITDA (in billions) |
Gross Profit (in billions) |
Revenue Growth |
| Tesla Inc |
38.03 |
8.31 |
5.89 |
13.66% |
$3.48 |
$4.44 |
3.49% |
| Toyota Motor Corp |
10.42 |
1.43 |
1.07 |
4.21% |
$2385.42 |
$2685.29 |
23.44% |
| Honda Motor Co Ltd |
9.31 |
0.71 |
0.45 |
2.07% |
$626.97 |
$1174.13 |
21.45% |
| Ford Motor Co |
11.17 |
1.12 |
0.28 |
-1.21% |
$0.2 |
$2.53 |
4.46% |
| General Motors Co |
5.56 |
0.73 |
0.32 |
2.99% |
$4.51 |
$3.31 |
-0.3% |
| Li Auto Inc |
24.45 |
4.52 |
2.32 |
9.95% |
$4.19 |
$9.79 |
20.34% |
| Thor Industries Inc |
20.56 |
1.41 |
0.54 |
0.18% |
$0.1 |
$0.27 |
-5.93% |
| Winnebago Industries Inc |
12.29 |
1.40 |
0.69 |
1.9% |
$0.05 |
$0.12 |
-19.87% |
| Average |
13.39 |
1.62 |
0.81 |
2.87% |
$431.63 |
$553.63 |
6.23% |
When closely examining Tesla, the following trends emerge:
-
Notably, the current Price to Earnings ratio for this stock, 38.03, is 2.84x above the industry norm, reflecting a higher valuation relative to the industry.
-
The elevated Price to Book ratio of 8.31 relative to the industry average by 5.13x suggests company might be overvalued based on its book value.
-
The Price to Sales ratio of 5.89, which is 7.27x the industry average, suggests the stock could potentially be overvalued in relation to its sales performance compared to its peers.
-
The Return on Equity (ROE) of 13.66% is 10.79% above the industry average, highlighting efficient use of equity to generate profits.
-
With lower Earnings Before Interest, Taxes, Depreciation, and Amortization (EBITDA) of $3.48 Billion, which is 0.01x below the industry average, the company may face lower profitability or financial challenges.
-
Compared to its industry, the company has lower gross profit of $4.44 Billion, which indicates 0.01x below the industry average, potentially indicating lower revenue after accounting for production costs.
-
The company's revenue growth of 3.49% is significantly lower compared to the industry average of 6.23%. This indicates a potential fall in the company's sales performance.
Debt To Equity Ratio
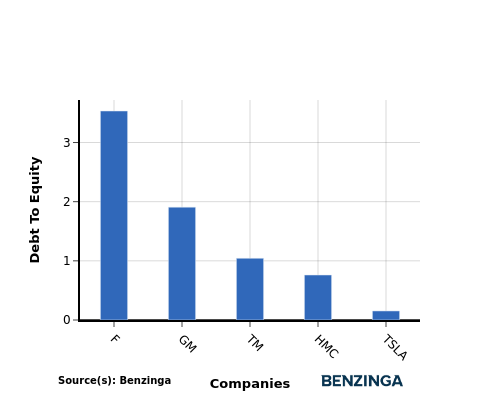
The debt-to-equity (D/E) ratio is a financial metric that helps determine the level of financial risk associated with a company's capital structure.
Considering the debt-to-equity ratio in industry comparisons allows for a concise evaluation of a company's financial health and risk profile, aiding in informed decision-making.
By analyzing Tesla in relation to its top 4 peers based on the Debt-to-Equity ratio, the following insights can be derived:
-
Tesla is in a relatively stronger financial position compared to its top 4 peers, as evidenced by its lower debt-to-equity ratio of 0.15.
-
This implies that the company relies less on debt financing and has a more favorable balance between debt and equity.
Key Takeaways
For Tesla in the Automobiles industry, the PE, PB, and PS ratios are all high compared to its peers, indicating a potentially overvalued stock. On the other hand, Tesla's high ROE suggests strong profitability, while its low EBITDA, gross profit, and revenue growth may raise concerns about operational efficiency and future growth prospects relative to industry competitors.
This article was generated by Benzinga's automated content engine and reviewed by an editor.
Posted In: TSLA


