Gold Miners Consolidate Recent Surge As Spot Gold Takes A Breather: A Technical Analysis Of Major ETF
Author: Melanie Schaffer | March 12, 2024 02:16pm
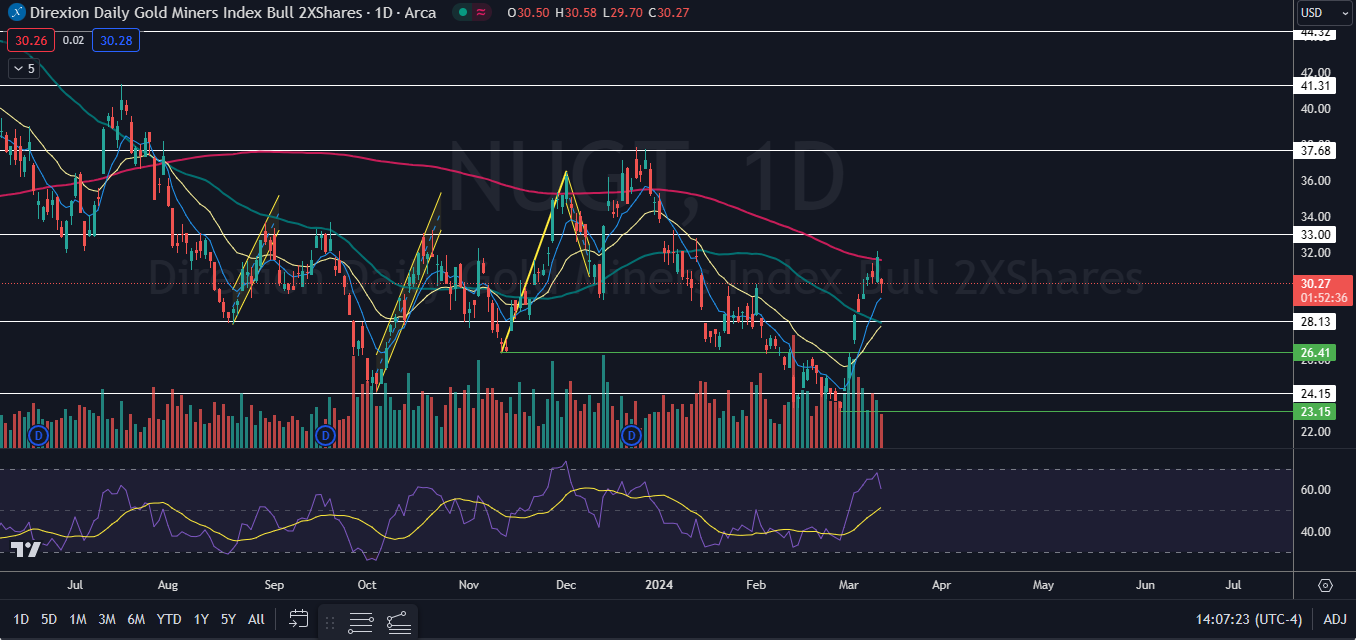
Direxion Daily Gold Miners Index Bull 2X Shares (NYSE:NUGT) was consolidating on Tuesday after closing Monday’s session on top of the 200-day simple moving average (SMA) –a level a stock or ETF rarely breaks through on the first attempt, which Benzinga pointed out on Friday.
The move lower came in tandem with spot gold, which was trading down about 1% after reaching a new all-time high of $2,195.15 on Friday, where the commodity’s relative strength index was measuring in at about 84%, indicating gold was heavily overbought.
For NUGT, Tuesday’s downturn was taking place on decreasing volume, indicating that the bulls are taking a breath rather than that the bears have gained control. The ETF was also working to print a hammer candlestick, indicating the local bottom may have occurred.
Read Next: Gold Speculators Pave Ground For 'Multi-Year Bull Market In Metals'
Trending: Which Public Companies Own Bitcoin? This Giant Is The Odd One Out In The Top 5
NUGT is a double-leveraged fund that is designed to outperform the NYSE Arca Gold Miners Index by 200%. The ETF tracks several gold and silver mining companies, with Newmont Corp (NYSE:NEM), Barrick Gold Corp (NYSE:GOLD), Agnico Eagle Mines Ltd (NYSE:AEM), Wheaton Precious Metals Corp (NYSE:WPM) and Franco-Nevada Corp (NYSE:FNV) making up its top five holdings.
It should be noted that leveraged ETFs are meant to be used as a trading vehicle by experienced traders, as opposed to a long-term investment. Leveraged ETFs should never be used by an investor with a buy-and-hold strategy or those who have low-risk appetites.
For traders wanting to play the gold mining index bearishly, Direxion offers Direxion Daily Gold Miners Index Bear 2X Shares (NYSE:DUST).
Want direct analysis? Find me in the BZ Pro lounge! Click here for a free trial.
The NUGT Chart: NUGT’s retracement on Tuesday came down toward the eight-day exponential moving average (EMA), where bulls came in and bought the dip. The price action was causing the ETF to form a bullish hammer candlestick and possibly print a higher low, which could confirm a new uptrend.
- Although NUGT closed on top of the 200-day SMA on Tuesday, the downturn in spot gold paired with the technical resistance at that area caused the ETF to open lower. If NUGT continues to consolidate mostly sideways on lower-than-average volume over the next few trading days, it becomes more likely the ETF will eventually break up above the 200-day, which would throw NUGT into a bull cycle.
- Bearish traders want to see big bearish volume come in and drop NUGT down under the eight-day EMA, which could accelerate downside pressure. If that happens, the possible bull flag NUGT is beginning to form under the 200-day SMA will be negated.
- NUGT has resistance above at $33 and at $37.68 and support below at $28.13 and at $26.41.
Featured image sourced from Shutterstock
Posted In: AEM DUST FNV GOLD NEM NUGT WPM