Gold Surges In Blue Skies, Mining Sector Prepares For Bull Cycle: This ETF Offers 2X Leverage During A Run Higher
Author: Melanie Schaffer | March 08, 2024 02:41pm
Direxion Daily Gold Miners Index Bull 2X Shares (NYSE:NUGT) has surged about 33% since Feb. 28, propelled by the price of spot gold, which has closed at a new all-time high each day this week.
On Friday, gold reached the $2,195 level on Monday, causing its relative strength index to continue climbing well into overbought territory. Once the commodity enters a consolidation phase, further bullish momentum is likely to trickle down into the gold mining sector, beginning with large-cap companies and eventually flowing through into juniors.
Must Read: Asia Up, Europe Markets Down, Gold Hovers Near Record High - Global Markets Today While Us Slept
Trending: Apple's $1B Gamble On 3 Blockbusters: Box Office Results, Streaming Impact, And Oscar Nominations
For traders hoping to catch the potential confirmed bull cycle in the gold mining sector, NUGT looks to be headed over the 200-day simple moving average (SMA) and if the ETF regains that area as support and trades above the level for a period of time, the 50-day SMA will cross above the 200-day, causing a golden cross to form.
NUGT is a double-leveraged fund that is designed to outperform the NYSE Arca Gold Miners Index by 200%. The ETF tracks several gold and silver mining companies, with Newmont Corp (NYSE:NEM), Barrick Gold Corp (NYSE:GOLD) and Franco-Nevada Corp (NYSE:FNV) making up 30.05% of its holdings.
It should be noted that leveraged ETFs are meant to be used as a trading vehicle by experienced traders, as opposed to a long-term investment. Leveraged ETFs should never be used by an investor with a buy-and-hold strategy or those who have low-risk appetites.
For traders wanting to play the gold mining index bearishly, Direxion offers Direxion Daily Gold Miners Index Bear 2X Shares (NYSE:DUST).
Want direct analysis? Find me in the BZ Pro lounge! Click here for a free trial.
The NUGT Chart: NUGT hit a low of $23.15 on Feb. 28, where the ETF reversed course and on March 1, NUGT popped up above the fund’s most recent lower high, which negated its downtrend. Since then, NUGT has made a consistent series of higher highs without retracing to form a higher low.
- For a higher low to form on the daily chart, which would confirm a new uptrend, NUGT will have to retrace or consolidate. The consolidation may take place over the next few trading days because a stock or ETF rarely breaks up through the 200-day SMA on the first attempt.
- NUGT was also looking to print a doji candlestick on Friday, which may indicate the local top has occurred. Traders can watch for a possible retracement to take place on Monday, which could provide a solid entry point for bullish traders who aren’t already in a position.
- Bearish traders may want to wait for signs that bullish momentum is decreasing and that a longer-term downturn is on the horizon.
- NUGT has resistance above at $33 and at $37.68 and support below at $28.13 and at $26.41.
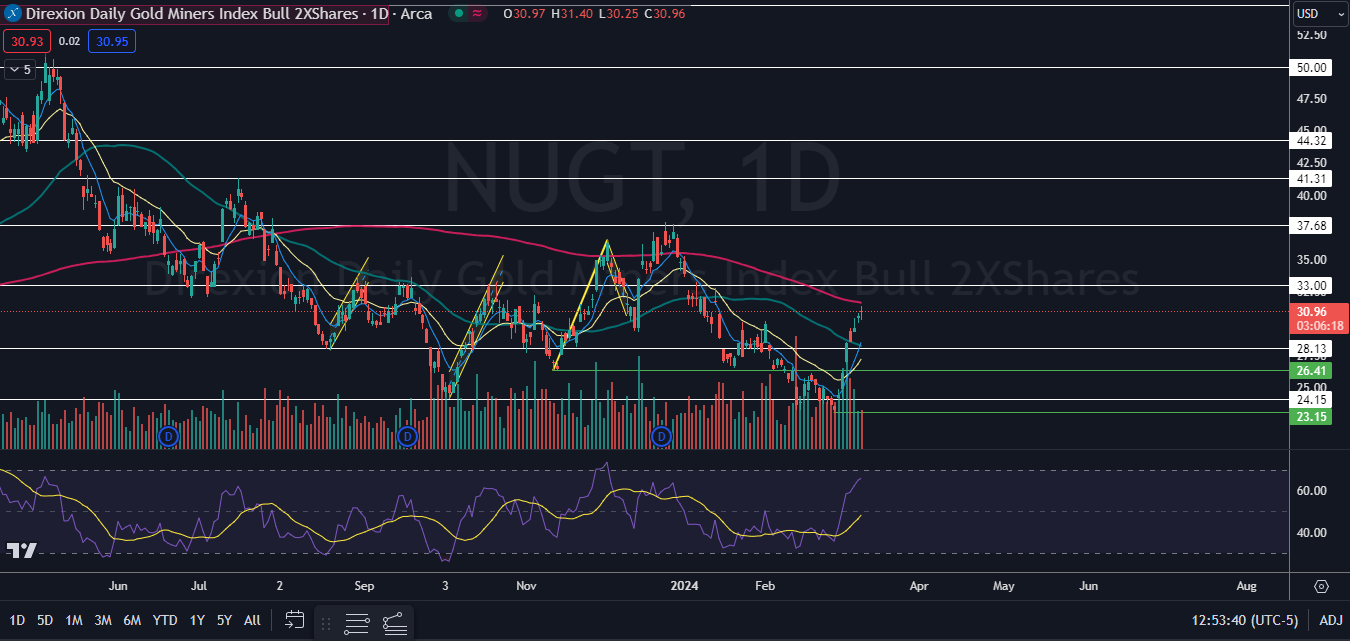
Image sourced from Shutterstock
Posted In: DUST FNV GOLD NEM NUGT