This rally shifted the week’s momentum to positive, potentially marking the 17th gain in the last 19 weeks, unless the index falls by 0.4% on Friday.
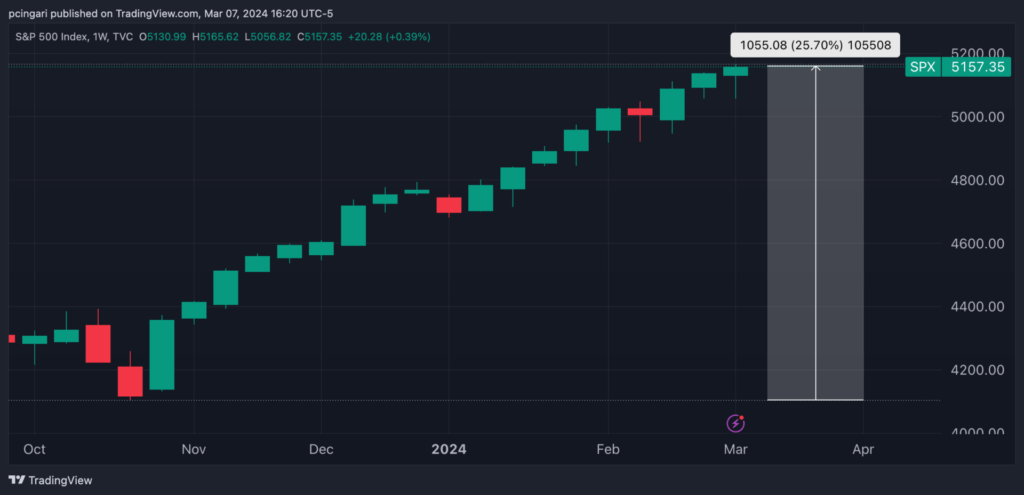
Since the end of October, the index, as monitored through the SPDR S&P 500 ETF Trust (NYSE:SPY), has surged over 25%, a testament to the strong trend driving the U.S. equity market.
Currently, the breadth of the market remains healthy with 71% of the S&P 500 stocks trading above their 50-day average, and an even more impressive 74% surpassing the 200-day average. The latter is inching closer to the 75% threshold, a peak not reached since January and the highest since October 2021.
Chart: S&P 500 Breaks All-Time Highs Again
Diverse Sector Performance Defines This Week’s Rally
In a significant departure from previous weeks when the technology sector was predominantly at the forefront of the S&P 500’s advances, this week witnessed a nuanced shift in market leadership.
Sectors that had previously lingered in the background, overshadowed by the tech behemoths, emerged as this week’s frontrunners.
The materials sector led the charge with a 2.8% increase, closely followed by utilities, energy, and consumer staples, showcasing gains of 2.4%, 2%, and 1.73%, respectively. The tech sector, usually the market darling, found itself in the fifth spot, rising by 1.69%.
Communication Services Select Sector SPDR Fund (NYSE:XLC)
0.43%
Consumer DiscretionarySelect Sector SPDR Fund (NYSE:XLY)
-1.87%
Extreme Technical Overbought Signals Emerge
Despite the euphoria surrounding the S&P 500’s record-breaking run, a closer examination of the technical landscape reveals emerging caution signs.
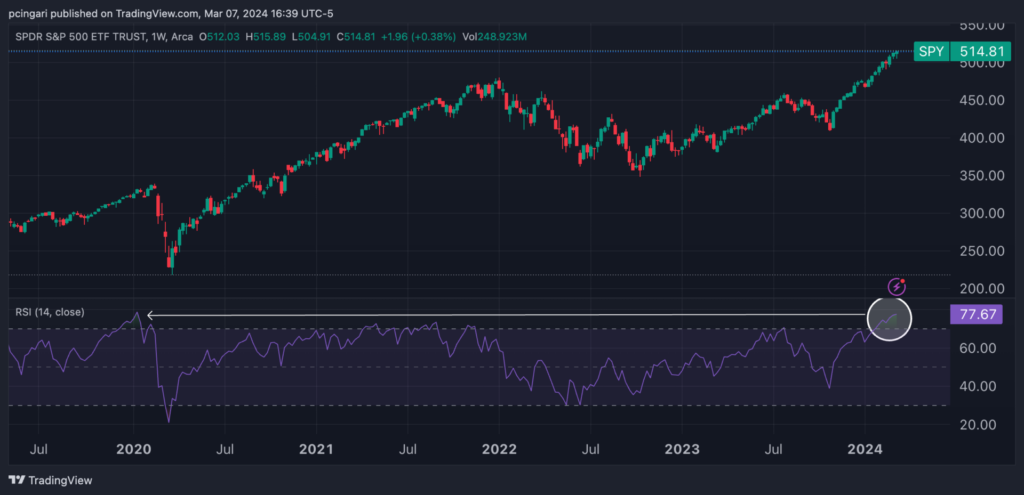
The index’s relentless upward trajectory has catapulted the Relative Strength Index (RSI) to a staggering 77, a figure not seen since January 2020, just before the global markets were roiled by the Covid-19 pandemic.
Such elevated RSI levels are traditionally viewed as overbought signals, suggesting that the current pace of the rally might be stretching the bounds of sustainability.
Chart: S&P 500’s Weekly RSI Reaches Most Overbought Levels In Four Year