In-Depth Examination Of 6 Analyst Recommendations For Realty Income
Author: Benzinga Insights | March 07, 2024 11:00am
In the latest quarter, 6 analysts provided ratings for Realty Income (NYSE:O), showcasing a mix of bullish and bearish perspectives.
In the table below, you'll find a summary of their recent ratings, revealing the shifting sentiments over the past 30 days and comparing them to the previous months.
|
Bullish |
Somewhat Bullish |
Indifferent |
Somewhat Bearish |
Bearish |
| Total Ratings |
3 |
2 |
1 |
0 |
0 |
| Last 30D |
1 |
0 |
0 |
0 |
0 |
| 1M Ago |
1 |
0 |
1 |
0 |
0 |
| 2M Ago |
1 |
1 |
0 |
0 |
0 |
| 3M Ago |
0 |
1 |
0 |
0 |
0 |
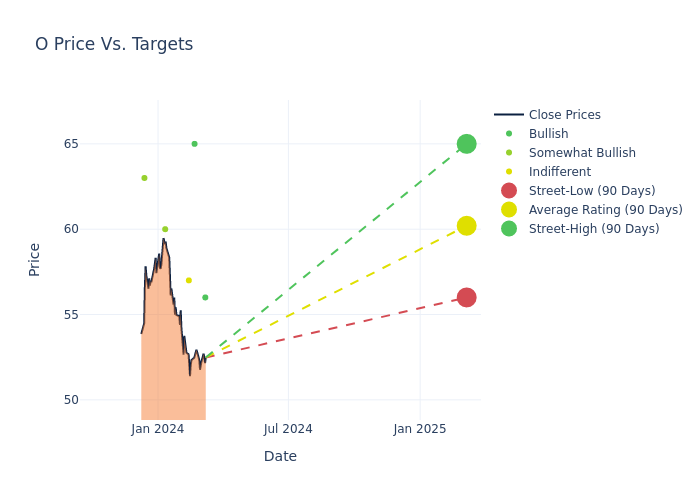
Insights from analysts' 12-month price targets are revealed, presenting an average target of $60.17, a high estimate of $65.00, and a low estimate of $56.00. This current average represents a 1.26% decrease from the previous average price target of $60.94.
Interpreting Analyst Ratings: A Closer Look
An in-depth analysis of recent analyst actions unveils how financial experts perceive Realty Income. The following summary outlines key analysts, their recent evaluations, and adjustments to ratings and price targets.
| Analyst |
Analyst Firm |
Action Taken |
Rating |
Current Price Target |
Prior Price Target |
| Vikram Malhorta |
Mizuho |
Lowers |
Buy |
$56.00 |
$60.00 |
| Simon Yarmak |
Stifel |
Lowers |
Buy |
$65.00 |
$67.75 |
| Eric Borden |
BMO Capital |
Announces |
Market Perform |
$57.00 |
- |
| Brad Heffern |
RBC Capital |
Raises |
Outperform |
$60.00 |
$58.00 |
| Vikram Malhorta |
Mizuho |
Raises |
Buy |
$60.00 |
$58.00 |
| Nate Crossett |
Exane BNP Paribas |
Announces |
Outperform |
$63.00 |
- |
Key Insights:
- Action Taken: In response to dynamic market conditions and company performance, analysts update their recommendations. Whether they 'Maintain', 'Raise', or 'Lower' their stance, it signifies their reaction to recent developments related to Realty Income. This insight gives a snapshot of analysts' perspectives on the current state of the company.
- Rating: Analysts unravel qualitative evaluations for stocks, ranging from 'Outperform' to 'Underperform'. These ratings offer insights into expectations for the relative performance of Realty Income compared to the broader market.
- Price Targets: Analysts set price targets as an estimate of a stock's future value. Comparing the current and prior price targets provides insight into how analysts' expectations have changed over time. This information can be valuable for investors seeking to understand consensus views on the stock's potential future performance.
Navigating through these analyst evaluations alongside other financial indicators can contribute to a holistic understanding of Realty Income's market standing. Stay informed and make data-driven decisions with our Ratings Table.
Stay up to date on Realty Income analyst ratings.
Discovering Realty Income: A Closer Look
Realty Income owns roughly 13,300 properties, most of which are freestanding, single-tenant, triple-net-leased retail properties. Its properties are located in 49 states and Puerto Rico and are leased to 250 tenants from 47 industries. Recent acquisitions have added industrial, gaming, office, manufacturing, and distribution properties, which make up roughly 17% of revenue.
Financial Insights: Realty Income
Market Capitalization Analysis: With a profound presence, the company's market capitalization is above industry averages. This reflects substantial size and strong market recognition.
Revenue Growth: Over the 3 months period, Realty Income showcased positive performance, achieving a revenue growth rate of 21.11% as of 31 December, 2023. This reflects a substantial increase in the company's top-line earnings. As compared to competitors, the company surpassed expectations with a growth rate higher than the average among peers in the Real Estate sector.
Net Margin: Realty Income's net margin lags behind industry averages, suggesting challenges in maintaining strong profitability. With a net margin of 20.29%, the company may face hurdles in effective cost management.
Return on Equity (ROE): Realty Income's ROE lags behind industry averages, suggesting challenges in maximizing returns on equity capital. With an ROE of 0.68%, the company may face hurdles in achieving optimal financial performance.
Return on Assets (ROA): Realty Income's ROA lags behind industry averages, suggesting challenges in maximizing returns from its assets. With an ROA of 0.39%, the company may face hurdles in achieving optimal financial performance.
Debt Management: Realty Income's debt-to-equity ratio is below the industry average at 0.67, reflecting a lower dependency on debt financing and a more conservative financial approach.
How Are Analyst Ratings Determined?
Analysts work in banking and financial systems and typically specialize in reporting for stocks or defined sectors. Analysts may attend company conference calls and meetings, research company financial statements, and communicate with insiders to publish "analyst ratings" for stocks. Analysts typically rate each stock once per quarter.
Beyond their standard evaluations, some analysts contribute predictions for metrics like growth estimates, earnings, and revenue, furnishing investors with additional guidance. Users of analyst ratings should be mindful that this specialized advice is shaped by human perspectives and may be subject to variability.
This article was generated by Benzinga's automated content engine and reviewed by an editor.
Posted In: O