Thriving with Robust Performance: Patrick Industries Delivers Growing Profits to Investors
Author: Benzinga Insights | March 04, 2024 11:05am
On March 04, 2024, Patrick Industries (NASDAQ:PATK) will distribute a dividend payout of $0.55 per share, equating to an annualized dividend yield of 2.14%. Shareholders who owned the stock before the ex-dividend date on February 16, 2024 will receive this payout.
Patrick Industries Recent Dividend Payouts
| Ex-Date |
Payments per year |
Dividend |
Yield |
Announced |
Record |
Payable |
| 2024-02-16 |
4 |
$0.55 |
2.14% |
2024-02-05 |
2024-02-20 |
2024-03-04 |
| 2023-11-24 |
4 |
$0.55 |
2.65% |
2023-11-15 |
2023-11-27 |
2023-12-11 |
| 2023-08-25 |
4 |
$0.45 |
2.23% |
2023-08-17 |
2023-08-28 |
2023-09-11 |
| 2023-06-09 |
4 |
$0.45 |
2.63% |
2023-05-25 |
2023-06-12 |
2023-06-26 |
| 2023-02-17 |
4 |
$0.45 |
2.33% |
2023-02-06 |
2023-02-21 |
2023-03-06 |
| 2022-11-25 |
4 |
$0.45 |
3.38% |
2022-11-11 |
2022-11-28 |
2022-12-12 |
| 2022-08-26 |
4 |
$0.33 |
2.3% |
2022-08-10 |
2022-08-29 |
2022-09-12 |
| 2022-05-27 |
4 |
$0.33 |
2.02% |
2022-05-13 |
2022-05-31 |
2022-06-13 |
| 2022-03-04 |
4 |
$0.33 |
1.91% |
2022-02-22 |
2022-03-07 |
2022-03-21 |
| 2021-11-26 |
4 |
$0.33 |
1.63% |
2021-11-12 |
2021-11-29 |
2021-12-13 |
| 2021-08-27 |
4 |
$0.28 |
1.29% |
2021-08-13 |
2021-08-30 |
2021-09-13 |
| 2021-05-28 |
4 |
$0.28 |
1.23% |
2021-05-14 |
2021-06-01 |
2021-06-14 |
With a dividend yield that places it neither at the top nor the bottom, Patrick Industries finds itself in the middle among its industry peers, while Standard Motor Products (NYSE:SMP) boasts the highest annualized dividend yield at 3.73%.
Analyzing Patrick Industries Financial Health
Companies that pay out steady cash dividends are attractive to income-seeking investors, and companies that are financially healthy tend to maintain their dividend payout schedule. For this reason, investors can find it insightful to see if a company has been increasing or decreasing their dividend payout schedule and if their earnings are growing.
YoY Growth in Dividend Per Share
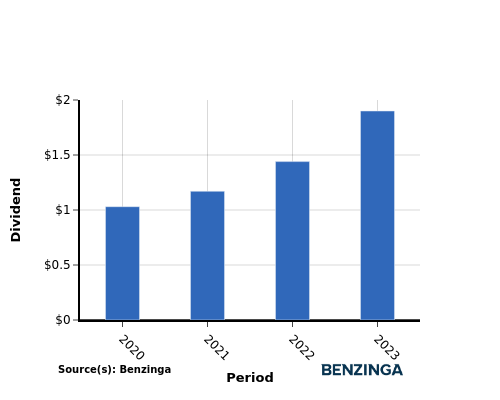
Investors witnessed an upward trajectory in the company's dividend per share between 2020 and 2023. The dividend per share rose from $1.03 to $1.90, indicating the company's dedication to enhancing shareholder value through increased dividends.
YoY Earnings Growth For Patrick Industries
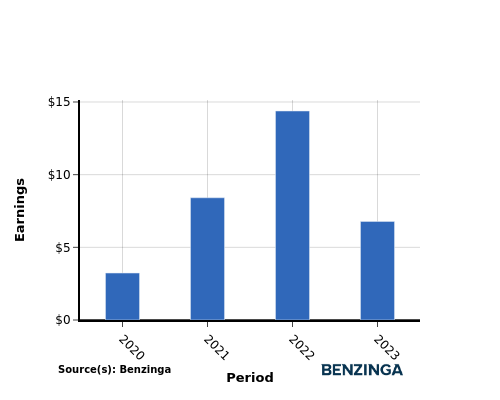
From 2020 to 2023, Patrick Industries has demonstrated an upward trend in earnings, with earnings per share rising from $3.23 to $6.78. This positive earnings growth bodes well for investors looking to generate income through cash dividend payouts.
Recap
In this article, we explore the recent dividend payout of Patrick Industries and its significance for shareholders. The company has decided to distribute a dividend of $0.55 per share today, which equates to an annualized dividend yield of 2.14%.
With a dividend yield that places it neither at the top nor the bottom, Patrick Industries finds itself in the middle among its industry peers, while Standard Motor Products boasts the highest annualized dividend yield at 3.73%.
The increase in both dividend per share and earnings per share from 2020 to 2023 for Patrick Industries indicates a positive financial trend, suggesting their capacity to continue distributing profits to shareholders.
Keeping a vigilant eye on the company's performance in the coming quarters will allow investors to stay current with any variations in financials or dividend disbursements.
[See current stock movements Patrick Industries on Benzinga.](https://www.benzinga.com/quote/Patrick Industries (NASDAQ: PATK))
This article was generated by Benzinga's automated content engine and reviewed by an editor.
Posted In: PATK SMP


