Stable Payouts, Increasing Performance: New York Community Supports Investors with Growing Earnings
Author: Benzinga Insights | February 28, 2024 11:05am
By the end of today, February 28, 2024, New York Community (NYSE:NYCB) is set to deliver a dividend payout of $0.05 per share, equating to an annualized dividend yield of 1.92%. Shareholders who owned the stock prior to the ex-dividend date on February 13, 2024 will receive this payout.
New York Community Recent Dividend Payouts
| Ex-Date |
Payments per year |
Dividend |
Yield |
Announced |
Record |
Payable |
| 2024-02-13 |
4 |
$0.05 |
1.92% |
2024-01-30 |
2024-02-14 |
2024-02-28 |
| 2023-11-03 |
4 |
$0.17 |
6.73% |
2023-10-26 |
2023-11-06 |
2023-11-16 |
| 2023-08-04 |
4 |
$0.17 |
5.56% |
2023-07-25 |
2023-08-07 |
2023-08-17 |
| 2023-05-05 |
4 |
$0.17 |
7.43% |
2023-04-25 |
2023-05-08 |
2023-05-18 |
| 2023-02-03 |
4 |
$0.17 |
6.97% |
2023-01-24 |
2023-02-06 |
2023-02-16 |
| 2022-11-04 |
4 |
$0.17 |
7.79% |
2022-10-25 |
2022-11-07 |
2022-11-17 |
| 2022-08-05 |
4 |
$0.17 |
7.24% |
2022-07-27 |
2022-08-08 |
2022-08-18 |
| 2022-05-06 |
4 |
$0.17 |
6.97% |
2022-04-27 |
2022-05-09 |
2022-05-19 |
| 2022-02-04 |
4 |
$0.17 |
5.58% |
2022-01-26 |
2022-02-07 |
2022-02-17 |
| 2021-11-04 |
4 |
$0.17 |
4.88% |
2021-10-27 |
2021-11-06 |
2021-11-16 |
| 2021-08-05 |
4 |
$0.17 |
6.18% |
2021-07-28 |
2021-08-07 |
2021-08-17 |
| 2021-05-06 |
4 |
$0.17 |
5.67% |
2021-04-26 |
2021-05-07 |
2021-05-18 |
In terms of dividend yield, New York Community finds itself in the middle ground among its industry peers, while TFS Financial (NASDAQ:TFSL) takes the lead with the highest annualized dividend yield at 8.69%.
Analyzing New York Community Financial Health
Companies that pay out steady cash dividends are attractive to income-seeking investors, and companies that are financially healthy tend to maintain their dividend payout schedule. For this reason, investors can find it insightful to see if a company has been increasing or decreasing their dividend payout schedule and if their earnings are growing.
YoY Growth in Dividend Per Share
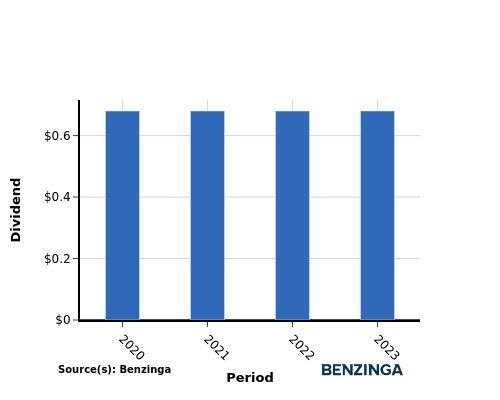
From 2020 to 2023, the company maintained a consistent dividend per share of $0.68. This signifies the company's dedication to a stable dividend policy, which is reassuring for shareholders seeking reliable returns on their investments.
YoY Earnings Growth For New York Community
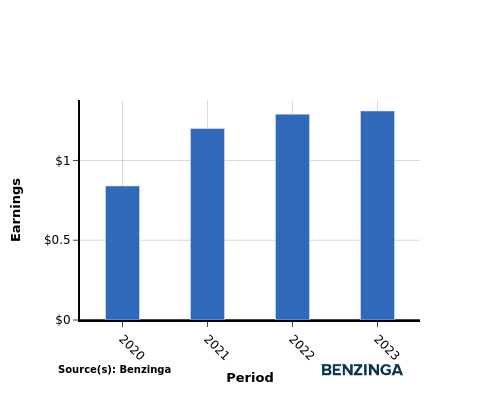
From 2020 to 2023, New York Community has demonstrated an upward trend in earnings, with earnings per share rising from $0.84 to $1.31. This positive earnings growth bodes well for investors looking to generate income through cash dividend payouts.
Recap
In this article, we delve into New York Community's recent dividend payout and examine how it impacts shareholders. The company has announced a dividend distribution of $0.05 per share today, resulting in an annualized dividend yield of 1.92%.
In terms of dividend yield, New York Community finds itself in the middle ground among its industry peers, while TFS Financial takes the lead with the highest annualized dividend yield at 8.69%.
Despite no adjustment in the dividend per share over the period of 2020 to 2023, the consistent growth in earnings per share for New York Community indicates a sound financial status, which could enable the company to continue sharing profits with its investors.
It is advisable for investors to monitor the company's performance in the coming quarters to stay in the loop about any adjustments in financials or dividend disbursements.
[See current stock movements New York Community on Benzinga.](https://www.benzinga.com/quote/New York Community (NYSE: NYCB))
This article was generated by Benzinga's automated content engine and reviewed by an editor.
Posted In: NYCB TFSL


