FB Financial Empowers Investors with Solid Returns and Fueling Shareholder Value
Author: Benzinga Insights | February 27, 2024 11:05am
By the end of today, February 27, 2024, FB Financial (NYSE:FBK) is set to deliver a dividend payout of $0.17 per share, equating to an annualized dividend yield of 1.73%. The company's dividend payout went ex-dividend on February 12, 2024, so only the investors that owned the stock prior to the ex-dividend date will receive this payout.
FB Financial Recent Dividend Payouts
| Ex-Date |
Payments per year |
Dividend |
Yield |
Announced |
Record |
Payable |
| 2024-02-12 |
4 |
$0.17 |
1.73% |
2024-01-31 |
2024-02-13 |
2024-02-27 |
| 2023-11-06 |
4 |
$0.15 |
2.01% |
2023-10-27 |
2023-11-07 |
2023-11-21 |
| 2023-08-11 |
4 |
$0.15 |
1.7% |
2023-08-02 |
2023-08-14 |
2023-09-05 |
| 2023-05-08 |
4 |
$0.15 |
2.06% |
2023-04-28 |
2023-05-09 |
2023-05-23 |
| 2023-02-06 |
4 |
$0.15 |
1.65% |
2023-01-26 |
2023-02-07 |
2023-02-21 |
| 2022-11-08 |
4 |
$0.13 |
1.29% |
2022-10-28 |
2022-11-09 |
2022-11-23 |
| 2022-08-05 |
4 |
$0.13 |
1.21% |
2022-07-29 |
2022-08-08 |
2022-08-22 |
| 2022-05-06 |
4 |
$0.13 |
1.31% |
2022-04-29 |
2022-05-09 |
2022-05-23 |
| 2022-02-07 |
4 |
$0.13 |
1.22% |
2022-01-28 |
2022-02-08 |
2022-02-22 |
| 2021-11-05 |
4 |
$0.11 |
0.97% |
2021-10-29 |
2021-11-08 |
2021-11-22 |
| 2021-08-06 |
4 |
$0.11 |
1.16% |
2021-07-30 |
2021-08-09 |
2021-08-23 |
| 2021-05-07 |
4 |
$0.11 |
1.03% |
2021-04-30 |
2021-05-10 |
2021-05-24 |
When comparing FB Financial's dividend yield against its industry peers, the company sits comfortably in the middle, with its peer Northwest Bancshares (NASDAQ:NWBI) having the highest annualized dividend yield at 6.99%.
Analyzing FB Financial Financial Health
Companies that pay out steady cash dividends are attractive to income-seeking investors, and companies that are financially healthy tend to maintain their dividend payout schedule. For this reason, investors can find it insightful to see if a company has been increasing or decreasing their dividend payout schedule and if their earnings are growing.
YoY Growth in Dividend Per Share
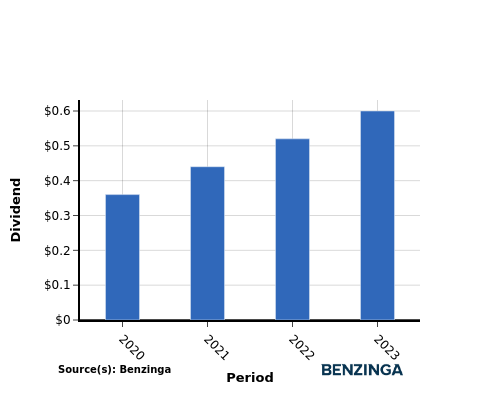
The company demonstrated a positive dividend growth pattern from 2020 to 2023, with the dividend per share rising from $0.36 to $0.60. This signifies the company's commitment to consistently increasing shareholder dividends.
YoY Earnings Growth For FB Financial
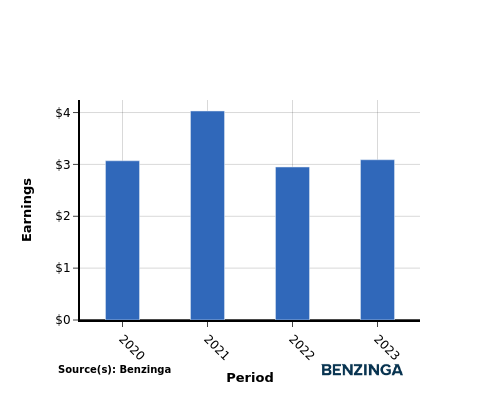
The earnings chart illustrates an increase in FB Financial's earnings per share, from $3.07 in 2020 to $3.09 in 2023. This positive earnings growth provides income-seeking investors with optimism, as it suggests potential for higher cash dividend payouts in the future.
Recap
In this article, we delve into FB Financial's recent dividend payout and examine how it impacts shareholders. The company has announced a dividend distribution of $0.17 per share today, resulting in an annualized dividend yield of 1.73%.
When comparing FB Financial's dividend yield against its industry peers, the company sits comfortably in the middle, with its peer Northwest Bancshares having the highest annualized dividend yield at 6.99%.
The increase in both dividend per share and earnings per share from 2020 to 2023 for FB Financial indicates a positive financial trend, suggesting their capacity to continue distributing profits to shareholders.
Investors are encouraged to closely track the company's performance in the upcoming quarters to stay informed of any updates in financials or dividend disbursements.
[See current stock movements FB Financial on Benzinga.](https://www.benzinga.com/quote/FB Financial (NYSE: FBK))
This article was generated by Benzinga's automated content engine and reviewed by an editor.
Posted In: FBK NWBI


