Forecasting The Future: 4 Analyst Projections For Trupanion
Author: Benzinga Insights | February 20, 2024 01:00pm
Throughout the last three months, 4 analysts have evaluated Trupanion (NASDAQ:TRUP), offering a diverse set of opinions from bullish to bearish.
The table below provides a snapshot of their recent ratings, showcasing how sentiments have evolved over the past 30 days and comparing them to the preceding months.
|
Bullish |
Somewhat Bullish |
Indifferent |
Somewhat Bearish |
Bearish |
| Total Ratings |
0 |
1 |
3 |
0 |
0 |
| Last 30D |
0 |
1 |
0 |
0 |
0 |
| 1M Ago |
0 |
0 |
2 |
0 |
0 |
| 2M Ago |
0 |
0 |
0 |
0 |
0 |
| 3M Ago |
0 |
0 |
1 |
0 |
0 |
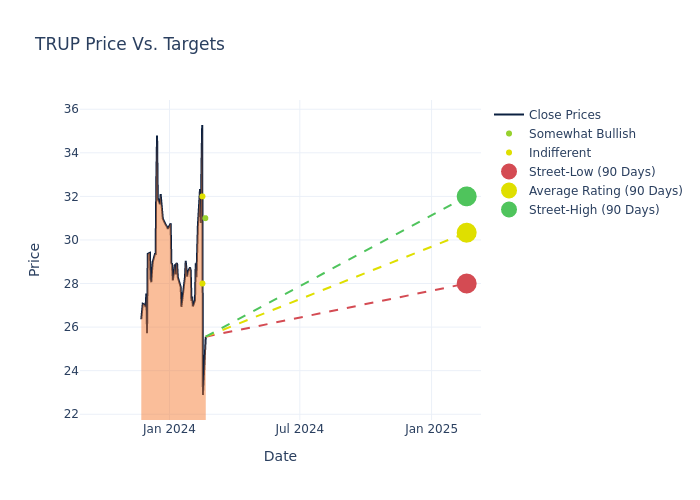
Insights from analysts' 12-month price targets are revealed, presenting an average target of $31.0, a high estimate of $33.00, and a low estimate of $28.00. This current average reflects an increase of 2.48% from the previous average price target of $30.25.
Deciphering Analyst Ratings: An In-Depth Analysis
The perception of Trupanion by financial experts is analyzed through recent analyst actions. The following summary presents key analysts, their recent evaluations, and adjustments to ratings and price targets.
| Analyst |
Analyst Firm |
Action Taken |
Rating |
Current Price Target |
Prior Price Target |
| Shweta Khajuria |
Evercore ISI Group |
Lowers |
Outperform |
$31.00 |
$35.00 |
| John Barnidge |
Piper Sandler |
Lowers |
Neutral |
$32.00 |
$33.00 |
| Jonathan Block |
Stifel |
Raises |
Hold |
$28.00 |
$25.00 |
| John Barnidge |
Piper Sandler |
Raises |
Neutral |
$33.00 |
$28.00 |
Key Insights:
- Action Taken: Analysts frequently update their recommendations based on evolving market conditions and company performance. Whether they 'Maintain', 'Raise' or 'Lower' their stance, it reflects their reaction to recent developments related to Trupanion. This information provides a snapshot of how analysts perceive the current state of the company.
- Rating: Analysts unravel qualitative evaluations for stocks, ranging from 'Outperform' to 'Underperform'. These ratings offer insights into expectations for the relative performance of Trupanion compared to the broader market.
- Price Targets: Analysts set price targets as an estimate of a stock's future value. Comparing the current and prior price targets provides insight into how analysts' expectations have changed over time. This information can be valuable for investors seeking to understand consensus views on the stock's potential future performance.
Analyzing these analyst evaluations alongside relevant financial metrics can provide a comprehensive view of Trupanion's market position. Stay informed and make data-driven decisions with the assistance of our Ratings Table.
Stay up to date on Trupanion analyst ratings.
If you are interested in following small-cap stock news and performance you can start by tracking it here.
All You Need to Know About Trupanion
Trupanion Inc is a specialty insurance products provider in the United States. Its core business is the sale of insurance products tailor-made for pets, especially cats and dogs. It operates in two business segments: The subscription business segment generates revenue primarily from subscription fees related to the Company's direct-to-consumer products and Other business segment is comprised of revenue from other product offerings that generally have a business-to-business relationship and a different margin profile than our subscription business segment, including revenue from writing policies on behalf of third parties and revenue from other products and software solutions.
A Deep Dive into Trupanion's Financials
Market Capitalization Analysis: Below industry benchmarks, the company's market capitalization reflects a smaller scale relative to peers. This could be attributed to factors such as growth expectations or operational capacity.
Revenue Growth: Over the 3 months period, Trupanion showcased positive performance, achieving a revenue growth rate of 3.5% as of 31 December, 2023. This reflects a substantial increase in the company's top-line earnings. As compared to its peers, the revenue growth lags behind its industry peers. The company achieved a growth rate lower than the average among peers in Financials sector.
Net Margin: Trupanion's net margin is below industry averages, indicating potential challenges in maintaining strong profitability. With a net margin of -0.73%, the company may face hurdles in effective cost management.
Return on Equity (ROE): Trupanion's ROE falls below industry averages, indicating challenges in efficiently using equity capital. With an ROE of -0.73%, the company may face hurdles in generating optimal returns for shareholders.
Return on Assets (ROA): Trupanion's ROA is below industry averages, indicating potential challenges in efficiently utilizing assets. With an ROA of -0.28%, the company may face hurdles in achieving optimal financial returns.
Debt Management: Trupanion's debt-to-equity ratio is below the industry average. With a ratio of 0.42, the company relies less on debt financing, maintaining a healthier balance between debt and equity, which can be viewed positively by investors.
What Are Analyst Ratings?
Analyst ratings serve as essential indicators of stock performance, provided by experts in banking and financial systems. These specialists diligently analyze company financial statements, participate in conference calls, and engage with insiders to generate quarterly ratings for individual stocks.
Some analysts publish their predictions for metrics such as growth estimates, earnings, and revenue to provide additional guidance with their ratings. When using analyst ratings, it is important to keep in mind that stock and sector analysts are also human and are only offering their opinions to investors.
If you want to keep track of which analysts are outperforming others, you can view updated analyst ratings along withanalyst success scores in Benzinga Pro.
This article was generated by Benzinga's automated content engine and reviewed by an editor.
Posted In: TRUP