Realty Income Stock: How Investors Can Buy For The Yield Ahead Of Q4 Earnings
Author: Surbhi Jain | February 19, 2024 12:12pm
Realty Income Corp (NYSE:O), will be reporting its fourth-quarter earnings on Feb. 20. Wall Street expects 33 cents in EPS and $1.02 billion in revenues as the company reports after market hours.
Realty Income is a REIT specializing in monthly dividend payments. It is often referred to as “The Monthly Dividend Company” due to its consistent and reliable dividend distribution to investors. Currently, forward dividend yield on the stock stands at 5.92%.
The 5-year average annualized dividend growth rate of Realty Income is 2.61%. The TTM year-over-year dividend growth rate is 3.02%.
Realty Income Technical Setup Ahead Of Q4 Earnings
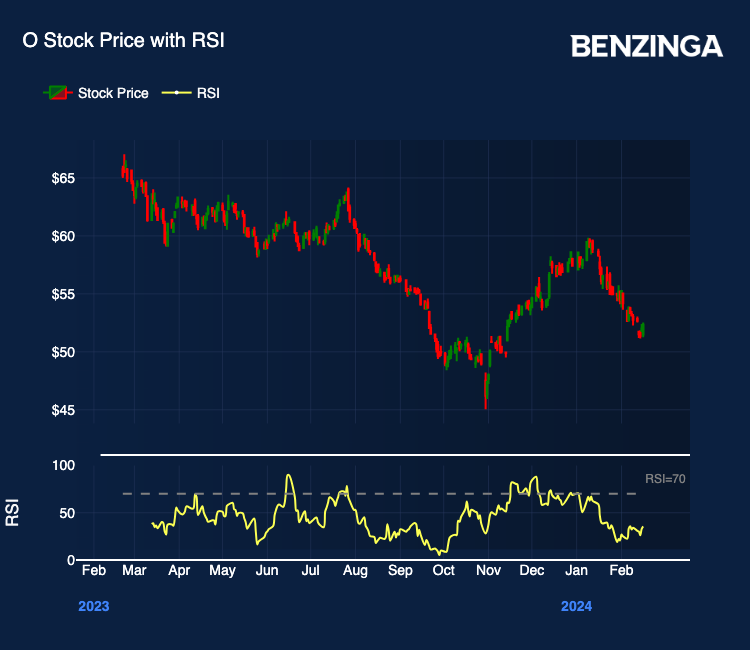
As Realty Income prepares to report fourth-quarter earnings, a technical assessment of its price chart indicates a strongly bearish trend.
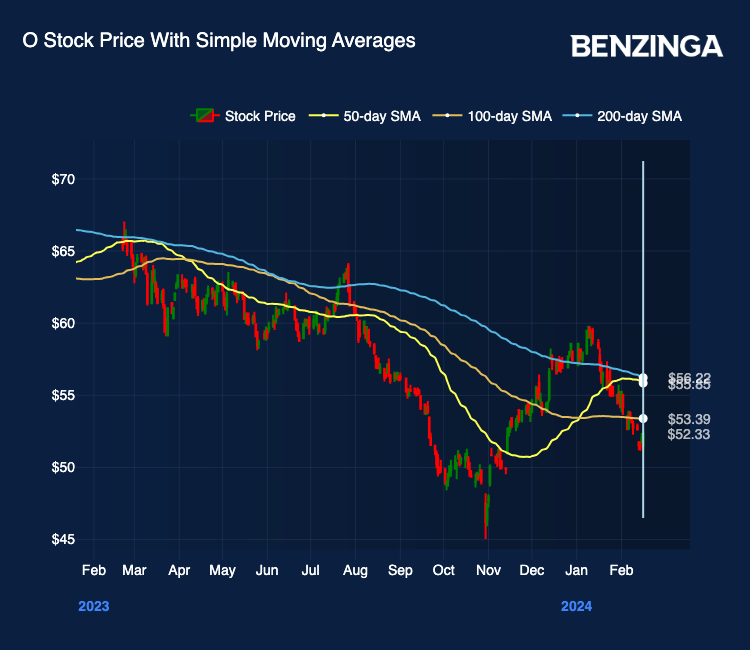
Realty Income share price is currently below its five-, 20-, and 50-day exponential moving averages. Despite this bearish sentiment, there is evidence of buying pressure, which suggests a potential future bullish movement.
Presently priced at $52.33, Realty Income’s 8-day simple moving average (SMA) at $52.40 signals a Sell, as does the 20-day SMA at $53.82 and the 50-day SMA at $55.85. The 200-day SMA at $56.22 further supports a Sell signal.
Similarly, the 8-day, 20-day and 50-day exponential moving averages are all indicating a Sell as well.
The Moving Average Convergence Divergence (MACD) indicator at -1.13 suggests a Sell, and the Relative Strength Index (RSI) at 35.46 indicates oversold conditions.
Additionally, both the Bollinger Bands (25) and Bollinger Bands (100) point to a Sell recommendation for Realty Income, with respective ranges of ($52.57-$56.51) and ($50.14-$56.64).
Realty Income Analysts Consensus Ratings
Ratings & Consensus Estimates:Consensus analyst ratings on Realty Income stock stand at Neutral currently with a price target of $57.89 a share.
Price Action: Realty Income stock was trading at $52.33 at the time of the close of trading on Feb. 18.