Magnificent 7 Stocks Trigger Concerns Of Market Overheat: Bubble Trouble?
Author: Piero Cingari | February 16, 2024 12:05pm
Bank of America Chief Market Strategist Michael Hartnett has drawn a compelling parallel between the current surge in the U.S. “Magnificent Seven” stocks and historical market bubbles dating back to the 18th century.
Hartnett’s insights reveal that while every bubble is unique, they share common catalysts such as technological innovation, new markets and, notably, central bank easing. These elements have historically converged to inflate asset prices beyond sustainable levels.
The AI bubble, for example, was ignited by the Federal Reserve’s response to Silicon Valley Bank’s collapse and the subsequent rise of ChatGPT. This scenario mirrors past bubbles such as the Plaza Accord’s effect on Japan and the internet bubble fueled by the Long-Term Capital Management (LTCM) crisis.
Similarly, policy stimuli in response to the COVID-19 pandemic inflated crypto and tech stocks, reminiscent of the Mississippi and South Sea Company bubbles sparked by changes to English usury laws in 1714.
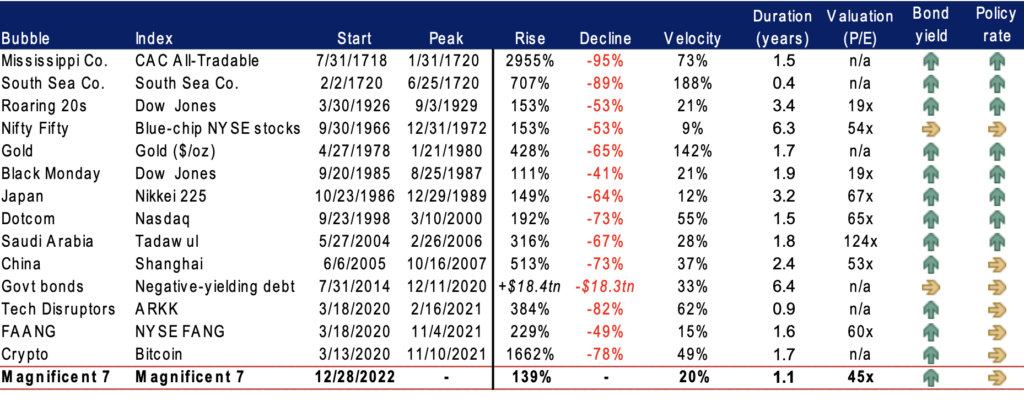
Magnificent 7 vs. Historical Market Bubbles
The Magnificent Seven is a moniker for today’s leading U.S. tech giants: Microsoft Corp. (NYSE:MSFT), Apple Inc. (NASDAQ:AAPL), Alphabet Inc. (NASDAQ:GOOG) (NASDAQ:GOOGL), Amazon.com Inc. (NASDAQ:AMZN), Meta Platforms Inc. (NASDAQ:META), NVIDIA Corp. (NASDAQ:NVDA) and Tesla, Inc. (NASDAQ:TSLA). These companies’ stocks have seen an astonishing 140% gain in the past 12 months.
This surge is approaching historic proportions, nearing the 180% rise of the Dow Jones in the 1920s, surpassing the 150% gains of the Nifty 50 in the ’70s and Japan’s stocks in the ’80s, but still shy of the 190% increase during the internet bubble and the 230% surge in FAANG stocks from COVID-19 pandemic lows.
Source: Bank of America
The Inevitable Pop: Rising Treasury Yields as the Harbinger
A significant concern highlighted by Hartnett is the concentration of market gains.
The top five stocks have contributed to 75% of the S&P 500’s year-to-date (YTD) gains, with the top three tech stocks alone accounting for 90% of the tech sector’s YTD growth.
Furthermore, the current “breadth” of the U.S. equity market, measured by the ratio between the cap-weighted S&P 500, as tracked by the SPDR S&P 500 ETF (NYSE:SPY), and the equal-weighted S&P 500, as tracked by the Invesco S&P 500 Equal Weight ETF (NYSE:RSP), is at its worst level since March 2009.
Historically, rising Treasury bond yields have signaled the peak and subsequent pop of market bubbles.
Hartnett notes that in 12 of the 14 bubbles observed, increasing yields were a precursor to a market downturn. Given the global debt’s current unprecedented levels, a modest increase in 10-year real rates to 2.5%-3% could precipitate the end of the current AI and Magnificent 7 mania.
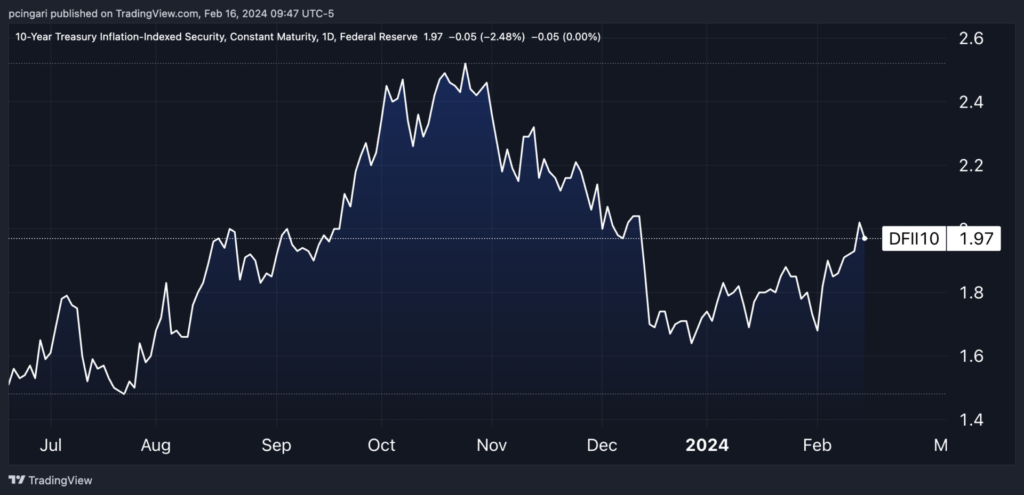
Currently, the real yield on a 10-year Treasury Inflation-Protected Security (TIPS) stands at approximately 2%, a figure that has not yet reached the threshold anticipated by Hartnett to trigger the bursting of the Magnificent Seven’s bubble.
Chart: US 10-Year Real Yields Hover Around 2% As Of Mid-February 2024