Unleashing Growth Potential: PCB Bancorp Surpasses Expectations with Strong Performance and Increasing Profits
Author: Benzinga Insights | February 16, 2024 11:05am
As the day concludes, PCB Bancorp (NASDAQ:PCB) is preparing to distribute a dividend payout of $0.18 per share, resulting in an annualized dividend yield of 4.07%. This payout is exclusive to investors who held the stock before the ex-dividend date on February 08, 2024.
PCB Bancorp Recent Dividend Payouts
| Ex-Date |
Payments per year |
Dividend |
Yield |
Announced |
Record |
Payable |
| 2024-02-08 |
4 |
$0.18 |
4.07% |
2024-01-25 |
2024-02-09 |
2024-02-16 |
| 2023-11-08 |
4 |
$0.18 |
4.79% |
2023-10-25 |
2023-11-09 |
2023-11-17 |
| 2023-08-10 |
4 |
$0.18 |
4.32% |
2023-07-27 |
2023-08-11 |
2023-08-18 |
| 2023-05-11 |
4 |
$0.18 |
5.41% |
2023-04-27 |
2023-05-12 |
2023-05-19 |
| 2023-02-09 |
4 |
$0.15 |
3.27% |
2023-01-26 |
2023-02-10 |
2023-02-17 |
| 2022-11-09 |
4 |
$0.15 |
3.03% |
2022-10-27 |
2022-11-10 |
2022-11-18 |
| 2022-08-11 |
4 |
$0.15 |
3.16% |
2022-07-28 |
2022-08-12 |
2022-08-19 |
| 2022-05-12 |
4 |
$0.15 |
2.88% |
2022-04-28 |
2022-05-13 |
2022-05-20 |
| 2022-02-10 |
4 |
$0.15 |
2.62% |
2022-01-27 |
2022-02-11 |
2022-02-18 |
| 2021-11-10 |
4 |
$0.12 |
2.38% |
2021-10-28 |
2021-11-12 |
2021-11-19 |
| 2021-08-05 |
4 |
$0.12 |
2.97% |
2021-07-22 |
2021-08-06 |
2021-08-13 |
| 2021-05-06 |
4 |
$0.1 |
2.79% |
2021-04-22 |
2021-05-07 |
2021-05-14 |
In terms of dividend yield, PCB Bancorp finds itself in the middle ground among its industry peers, while First of Long Island (NASDAQ:FLIC) takes the lead with the highest annualized dividend yield at 7.28%.
Analyzing PCB Bancorp Financial Health
Companies that pay out steady cash dividends are attractive to income-seeking investors, and companies that are financially healthy tend to maintain their dividend payout schedule. For this reason, investors can find it insightful to see if a company has been increasing or decreasing their dividend payout schedule and if their earnings are growing.
YoY Growth in Dividend Per Share
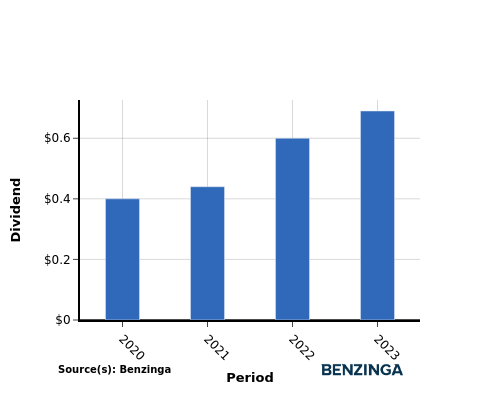
From 2020 to 2023, the company's dividend per share showed a positive trend, increasing steadily from $0.40 in 2020 to $0.69 in 2023. This demonstrates the company's commitment to rewarding shareholders by consistently raising dividends.
YoY Earnings Growth For PCB Bancorp
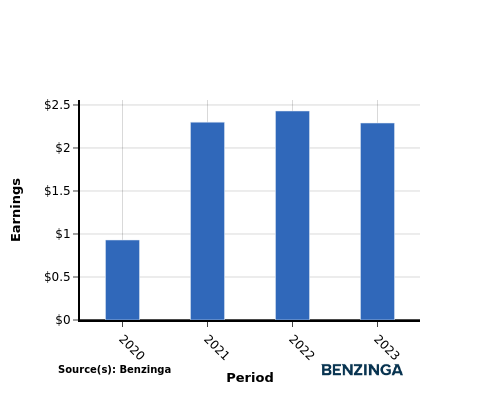
The earnings chart illustrates an increase in PCB Bancorp's earnings per share, from $0.93 in 2020 to $2.29 in 2023. This positive earnings growth provides income-seeking investors with optimism, as it suggests potential for higher cash dividend payouts in the future.
Recap
In this article, we delve into PCB Bancorp's recent dividend payout and examine how it impacts shareholders. The company has announced a dividend distribution of $0.18 per share today, resulting in an annualized dividend yield of 4.07%.
In terms of dividend yield, PCB Bancorp finds itself in the middle ground among its industry peers, while First of Long Island takes the lead with the highest annualized dividend yield at 7.28%.
With an increase in dividend per share and earnings per share from 2020 to 2023, PCB Bancorp demonstrates a healthy financial status and is likely to maintain their dividend distribution to investors.
Investors should closely follow the company's performance in the coming quarters to stay up-to-date on any shifts in financials or dividend disbursements.
\To stay up-to-date with the companies that are announcing their dividends, click here to visit our Dividends Calendar.
This article was generated by Benzinga's automated content engine and reviewed by an editor.
Posted In: FLIC PCB


