Nearly Half Of S&P 500 Stocks Trade Below 50-Day Moving Average: Which One Is The Cheapest?
Author: Piero Cingari | February 14, 2024 01:49pm
As the S&P 500 index continues to hover near the 5,000-point threshold, not far from its all-time highs, the remarkable surge of over 20% since late October levels created a stark divide with many corporations failing to join the market rally.
As of mid-February, nearly half of S&P 500 stocks were trading below the 50-day moving average, which represents a widely recognized technical indicator employed by traders for evaluating the short to medium-term direction of a stock’s price movement.
This observation suggests a substantial portion of the index’s components remains ensnared by bearish sentiment, highlighting a poor market breadth.
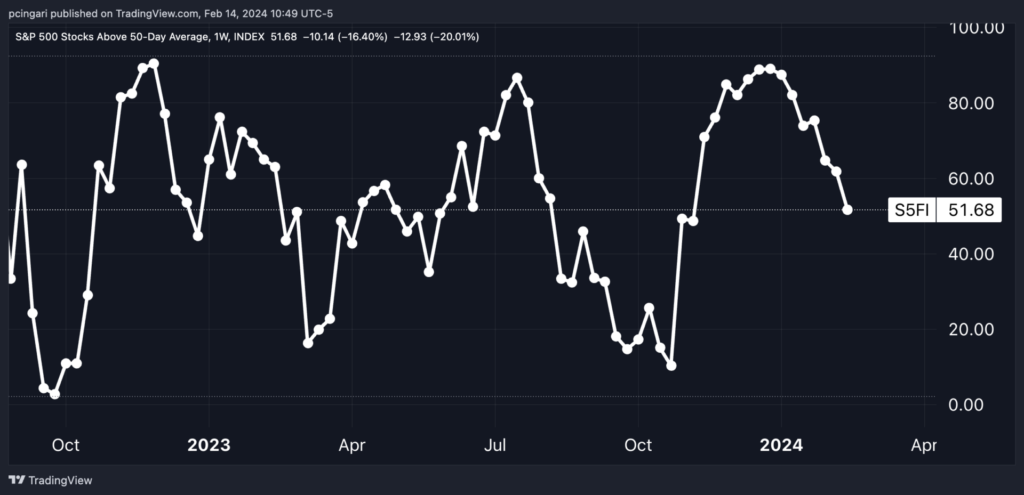
Chart: Only 51% Of S&P 500 Stocks Is Trading Above 50-Day Moving Average
In total, there are 232 S&P 500 stocks currently trading below their 50-day moving averages, among which 202 have a market capitalization of less than $100 billion. The remaining 30 stocks belong to the echelons of mega-cap companies, although they constitute just one-third of that exclusive group.
The contrast becomes even more pronounced when considering that only five out of the top 30 companies in the index are trading below their 50-day moving average. This suggests the elite tier of the S&P 500 largely remained well shielded from bearish pressures.
Top 10 Cheapest S&P 500 Companies, According To 50-Day Moving Average
Charter Communications, Inc. (NASDAQ:CHTR), Archer-Daniels-Midland Company (NYSE:ADM), and MarketAxess Holdings Inc. (NASDAQ:MKTX) are the three companies that trade the most “at a discount” relative to this technical indicator with distances of 20%, 19%, and 17%, respectively, off the 50-day average. None of these three corporations have a market capitalization in excess of $50 billion.
A significant surprise comes in fourth place, as Tesla Inc. (NASDAQ:TSLA) is positioned there, about 16% off its 50-day average.
With a market capitalization of almost $590 billion, Tesla is one of the mega-cap outliers in the group of S&P 500 companies that trade below the 50-day average. Within this group, there is Boeing Co (NYSE:BA), now 11% away from its moving average.
Top 10 Richest S&P 500 Companies, According To 50-Day Moving Average
Inverting the focus to stocks that have largely exceeded the 50-day moving average’s support, NVIDIA Corp. (NASDAQ:NVDA), Meta Platforms Inc. (NASDAQ:META), and Ely Lilly and Co (NYSE:LLY) lead the ranking, with 32%, 25%, and 21%, respectively, price premiums compared to the technical indicator.
Uber Technologies Inc. (NASDAQ:UBER) and Ralph Lauren Corp. (NYSE:RL) follow closely after with a 20% premium.