Peeling Back The Layers: Exploring Realty Income Through Analyst Insights
Author: Benzinga Insights | February 13, 2024 08:00am
5 analysts have shared their evaluations of Realty Income (NYSE:O) during the recent three months, expressing a mix of bullish and bearish perspectives.
Summarizing their recent assessments, the table below illustrates the evolving sentiments in the past 30 days and compares them to the preceding months.
|
Bullish |
Somewhat Bullish |
Indifferent |
Somewhat Bearish |
Bearish |
| Total Ratings |
1 |
3 |
1 |
0 |
0 |
| Last 30D |
0 |
0 |
1 |
0 |
0 |
| 1M Ago |
0 |
0 |
0 |
0 |
0 |
| 2M Ago |
1 |
1 |
0 |
0 |
0 |
| 3M Ago |
0 |
2 |
0 |
0 |
0 |
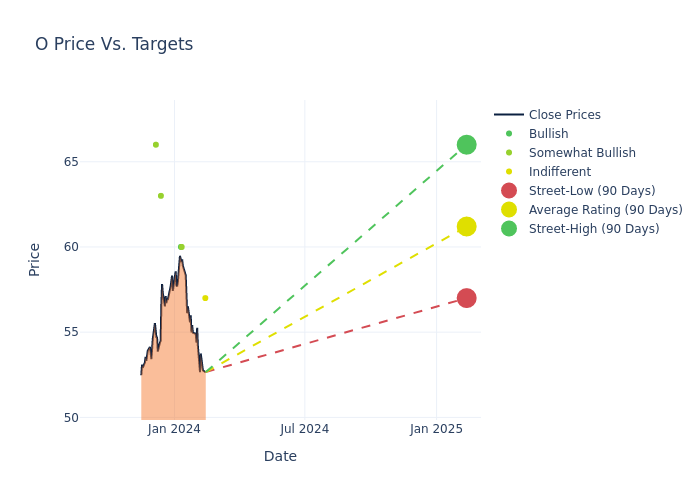
Analysts have recently evaluated Realty Income and provided 12-month price targets. The average target is $61.2, accompanied by a high estimate of $66.00 and a low estimate of $57.00. This current average reflects an increase of 5.52% from the previous average price target of $58.00.
Analyzing Analyst Ratings: A Detailed Breakdown
In examining recent analyst actions, we gain insights into how financial experts perceive Realty Income. The following summary outlines key analysts, their recent evaluations, and adjustments to ratings and price targets.
| Analyst |
Analyst Firm |
Action Taken |
Rating |
Current Price Target |
Prior Price Target |
| Eric Borden |
BMO Capital |
Announces |
Market Perform |
$57.00 |
- |
| Brad Heffern |
RBC Capital |
Raises |
Outperform |
$60.00 |
$58.00 |
| Vikram Malhorta |
Mizuho |
Raises |
Buy |
$60.00 |
$58.00 |
| Nate Crossett |
Exane BNP Paribas |
Announces |
Outperform |
$63.00 |
- |
| Andrew Rosivach |
Wolfe Research |
Announces |
Outperform |
$66.00 |
- |
Key Insights:
- Action Taken: In response to dynamic market conditions and company performance, analysts update their recommendations. Whether they 'Maintain', 'Raise', or 'Lower' their stance, it signifies their reaction to recent developments related to Realty Income. This insight gives a snapshot of analysts' perspectives on the current state of the company.
- Rating: Offering insights into predictions, analysts assign qualitative values, from 'Outperform' to 'Underperform'. These ratings convey expectations for the relative performance of Realty Income compared to the broader market.
- Price Targets: Analysts gauge the dynamics of price targets, providing estimates for the future value of Realty Income's stock. This comparison reveals trends in analysts' expectations over time.
Capture valuable insights into Realty Income's market standing by understanding these analyst evaluations alongside pertinent financial indicators. Stay informed and make strategic decisions with our Ratings Table.
Stay up to date on Realty Income analyst ratings.
Get to Know Realty Income Better
Realty Income owns roughly 13,300 properties, most of which are freestanding, single-tenant, triple-net-leased retail properties. Its properties are located in 49 states and Puerto Rico and are leased to 250 tenants from 47 industries. Recent acquisitions have added industrial, gaming, office, manufacturing, and distribution properties, which make up roughly 17% of revenue.
Realty Income's Financial Performance
Market Capitalization Analysis: With a profound presence, the company's market capitalization is above industry averages. This reflects substantial size and strong market recognition.
Revenue Growth: Realty Income displayed positive results in 3 months. As of 30 September, 2023, the company achieved a solid revenue growth rate of approximately 24.11%. This indicates a notable increase in the company's top-line earnings. When compared to others in the Real Estate sector, the company excelled with a growth rate higher than the average among peers.
Net Margin: Realty Income's net margin excels beyond industry benchmarks, reaching 22.47%. This signifies efficient cost management and strong financial health.
Return on Equity (ROE): Realty Income's ROE is below industry standards, pointing towards difficulties in efficiently utilizing equity capital. With an ROE of 0.74%, the company may encounter challenges in delivering satisfactory returns for shareholders.
Return on Assets (ROA): The company's ROA is below industry benchmarks, signaling potential difficulties in efficiently utilizing assets. With an ROA of 0.43%, the company may need to address challenges in generating satisfactory returns from its assets.
Debt Management: Realty Income's debt-to-equity ratio is below the industry average at 0.66, reflecting a lower dependency on debt financing and a more conservative financial approach.
The Basics of Analyst Ratings
Experts in banking and financial systems, analysts specialize in reporting for specific stocks or defined sectors. Their comprehensive research involves attending company conference calls and meetings, analyzing financial statements, and engaging with insiders to generate what are known as analyst ratings for stocks. Typically, analysts assess and rate each stock once per quarter.
In addition to their assessments, some analysts extend their insights by offering predictions for key metrics such as earnings, revenue, and growth estimates. This supplementary information provides further guidance for traders. It is crucial to recognize that, despite their specialization, analysts are human and can only provide forecasts based on their beliefs.
This article was generated by Benzinga's automated content engine and reviewed by an editor.
Posted In: O