The Analyst Landscape: 6 Takes On T. Rowe Price Gr
Author: Benzinga Insights | February 09, 2024 11:00am
Providing a diverse range of perspectives from bullish to bearish, 6 analysts have published ratings on T. Rowe Price Gr (NASDAQ:TROW) in the last three months.
The table below provides a concise overview of recent ratings by analysts, offering insights into the changing sentiments over the past 30 days and drawing comparisons with the preceding months for a holistic perspective.
|
Bullish |
Somewhat Bullish |
Indifferent |
Somewhat Bearish |
Bearish |
| Total Ratings |
0 |
0 |
2 |
3 |
1 |
| Last 30D |
0 |
0 |
0 |
1 |
0 |
| 1M Ago |
0 |
0 |
1 |
0 |
1 |
| 2M Ago |
0 |
0 |
1 |
2 |
0 |
| 3M Ago |
0 |
0 |
0 |
0 |
0 |
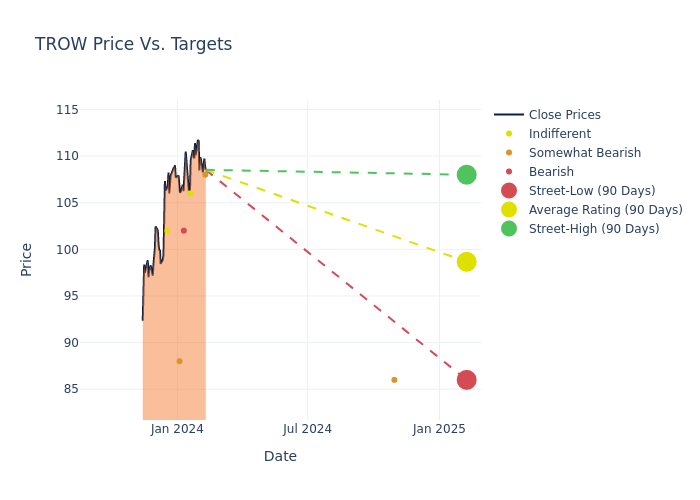
Analysts have set 12-month price targets for T. Rowe Price Gr, revealing an average target of $101.83, a high estimate of $108.00, and a low estimate of $88.00. Witnessing a positive shift, the current average has risen by 6.29% from the previous average price target of $95.80.
Interpreting Analyst Ratings: A Closer Look
A comprehensive examination of how financial experts perceive T. Rowe Price Gr is derived from recent analyst actions. The following is a detailed summary of key analysts, their recent evaluations, and adjustments to ratings and price targets.
| Analyst |
Analyst Firm |
Action Taken |
Rating |
Current Price Target |
Prior Price Target |
| Finian O'Shea |
Wells Fargo |
Raises |
Underweight |
$108.00 |
$105.00 |
| Michael Cyprys |
Morgan Stanley |
Raises |
Equal-Weight |
$106.00 |
$101.00 |
| Brennan Hawken |
UBS |
Raises |
Sell |
$102.00 |
$86.00 |
| Finian O'Shea |
Wells Fargo |
Raises |
Underweight |
$105.00 |
$95.00 |
| Bill Kirk |
TD Cowen |
Announces |
Underperform |
$88.00 |
- |
| Brian Bedell |
Deutsche Bank |
Raises |
Hold |
$102.00 |
$92.00 |
Key Insights:
- Action Taken: Analysts adapt their recommendations to changing market conditions and company performance. Whether they 'Maintain', 'Raise' or 'Lower' their stance, it reflects their response to recent developments related to T. Rowe Price Gr. This information provides a snapshot of how analysts perceive the current state of the company.
- Rating: Offering a comprehensive view, analysts assess stocks qualitatively, spanning from 'Outperform' to 'Underperform'. These ratings convey expectations for the relative performance of T. Rowe Price Gr compared to the broader market.
- Price Targets: Delving into movements, analysts provide estimates for the future value of T. Rowe Price Gr's stock. This analysis reveals shifts in analysts' expectations over time.
Assessing these analyst evaluations alongside crucial financial indicators can provide a comprehensive overview of T. Rowe Price Gr's market position. Stay informed and make well-judged decisions with the assistance of our Ratings Table.
Stay up to date on T. Rowe Price Gr analyst ratings.
About T. Rowe Price Gr
T. Rowe Price provides asset-management services for individual and institutional investors. It offers a broad range of no-load U.S. and international stock, hybrid, bond, and money market funds. At the end of October 2023, the firm had $1.312 trillion in managed assets, composed of equity (51%), balanced (33%), fixed-income and money market (13%), and alternatives (3%) offerings. Approximately two thirds of the company's managed assets are held in retirement-based accounts, which provides T. Rowe Price with a somewhat stickier client base than most of its peers. The firm also manages private accounts, provides retirement planning advice, and offers discount brokerage and trust services. The company is primarily a U.S.-based asset manager, deriving just over 9% of its AUM from overseas.
Understanding the Numbers: T. Rowe Price Gr's Finances
Market Capitalization Analysis: The company's market capitalization surpasses industry averages, showcasing a dominant size relative to peers and suggesting a strong market position.
Positive Revenue Trend: Examining T. Rowe Price Gr's financials over 3 months reveals a positive narrative. The company achieved a noteworthy revenue growth rate of 5.19% as of 30 September, 2023, showcasing a substantial increase in top-line earnings. As compared to its peers, the revenue growth lags behind its industry peers. The company achieved a growth rate lower than the average among peers in Financials sector.
Net Margin: T. Rowe Price Gr's net margin surpasses industry standards, highlighting the company's exceptional financial performance. With an impressive 26.49% net margin, the company effectively manages costs and achieves strong profitability.
Return on Equity (ROE): T. Rowe Price Gr's financial strength is reflected in its exceptional ROE, which exceeds industry averages. With a remarkable ROE of 4.74%, the company showcases efficient use of equity capital and strong financial health.
Return on Assets (ROA): T. Rowe Price Gr's ROA excels beyond industry benchmarks, reaching 3.52%. This signifies efficient management of assets and strong financial health.
Debt Management: T. Rowe Price Gr's debt-to-equity ratio is below the industry average. With a ratio of 0.03, the company relies less on debt financing, maintaining a healthier balance between debt and equity, which can be viewed positively by investors.
Understanding the Relevance of Analyst Ratings
Within the domain of banking and financial systems, analysts specialize in reporting for specific stocks or defined sectors. Their work involves attending company conference calls and meetings, researching company financial statements, and communicating with insiders to publish "analyst ratings" for stocks. Analysts typically assess and rate each stock once per quarter.
Beyond their standard evaluations, some analysts contribute predictions for metrics like growth estimates, earnings, and revenue, furnishing investors with additional guidance. Users of analyst ratings should be mindful that this specialized advice is shaped by human perspectives and may be subject to variability.
This article was generated by Benzinga's automated content engine and reviewed by an editor.
Posted In: TROW