Empowering Shareholders with Growth: PNC Finl Servs Gr Enhances Performance and Reports Rising Profits
Author: Benzinga Insights | February 05, 2024 11:05am
On February 05, 2024, PNC Finl Servs Gr (NYSE:PNC) will distribute a dividend payout of $1.55 per share, equating to an annualized dividend yield of 4.09%. Shareholders who owned the stock before the ex-dividend date on January 12, 2024 will receive this payout.
PNC Finl Servs Gr Recent Dividend Payouts
| Ex-Date |
Payments per year |
Dividend |
Yield |
Announced |
Record |
Payable |
| 2024-01-12 |
4 |
$1.55 |
4.09% |
2024-01-04 |
2024-01-16 |
2024-02-05 |
| 2023-10-16 |
4 |
$1.55 |
5.05% |
2023-10-02 |
2023-10-17 |
2023-11-05 |
| 2023-07-14 |
4 |
$1.55 |
4.92% |
2023-07-03 |
2023-07-17 |
2023-08-05 |
| 2023-04-17 |
4 |
$1.5 |
4.72% |
2023-04-03 |
2023-04-18 |
2023-05-05 |
| 2023-01-13 |
4 |
$1.5 |
3.76% |
2023-01-04 |
2023-01-17 |
2023-02-05 |
| 2022-10-14 |
4 |
$1.5 |
4.02% |
2022-10-03 |
2022-10-17 |
2022-11-05 |
| 2022-07-12 |
4 |
$1.5 |
3.8% |
2022-07-01 |
2022-07-13 |
2022-08-05 |
| 2022-04-12 |
4 |
$1.5 |
3.25% |
2022-04-01 |
2022-04-13 |
2022-05-05 |
| 2022-01-14 |
4 |
$1.25 |
2.32% |
2022-01-05 |
2022-01-18 |
2022-02-05 |
| 2021-10-14 |
4 |
$1.25 |
2.56% |
2021-10-01 |
2021-10-15 |
2021-11-05 |
| 2021-07-15 |
4 |
$1.25 |
2.62% |
2021-07-01 |
2021-07-16 |
2021-08-05 |
| 2021-04-15 |
4 |
$1.15 |
2.62% |
2021-04-01 |
2021-04-16 |
2021-05-05 |
When comparing PNC Finl Servs Gr's dividend yield against its industry peers, the company sits comfortably in the middle, with its peer HSBC Holdings (NYSE:HSBC) having the highest annualized dividend yield at 6.73%.
Analyzing PNC Finl Servs Gr Financial Health
Companies that pay out steady cash dividends are attractive to income-seeking investors, and companies that are financially healthy tend to maintain their dividend payout schedule. For this reason, investors can find it insightful to see if a company has been increasing or decreasing their dividend payout schedule and if their earnings are growing.
YoY Growth in Dividend Per Share
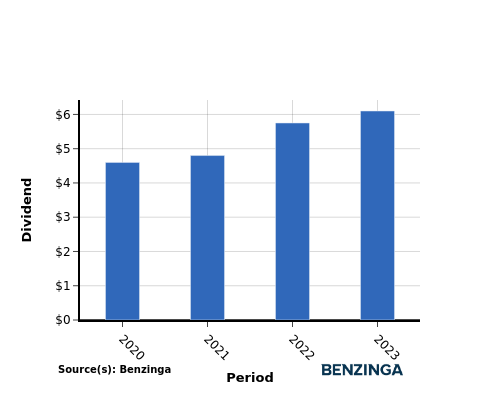
From 2020 to 2023, the company's dividend per share showed a positive trend, increasing steadily from $4.60 in 2020 to $6.10 in 2023. This demonstrates the company's commitment to rewarding shareholders by consistently raising dividends.
YoY Earnings Growth For PNC Finl Servs Gr
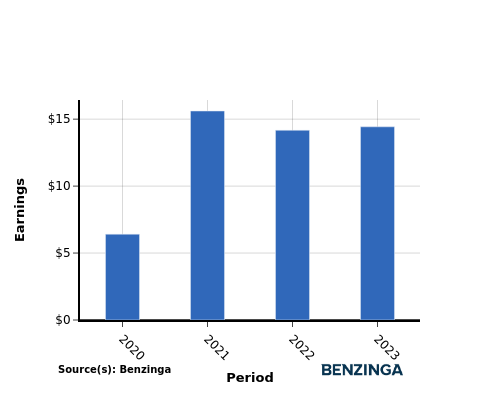
Investors can observe a growth in earnings for PNC Finl Servs Gr from 2020 to 2023, as earnings per share increased from $6.41 to $14.43. This upward trajectory in earnings indicates potential for future cash dividend payout increases, which can be advantageous for income-seeking investors.
Recap
In this article, we explore the recent dividend payout of PNC Finl Servs Gr and its significance for shareholders. The company has decided to distribute a dividend of $1.55 per share today, which equates to an annualized dividend yield of 4.09%.
When comparing PNC Finl Servs Gr's dividend yield against its industry peers, the company sits comfortably in the middle, with its peer HSBC Holdings having the highest annualized dividend yield at 6.73%.
Considering the increase in dividend per share from 2020 to 2023 along with an increase in earnings per share, PNC Finl Servs Gr appears to be in a strong financial position, indicating their ability to sustain dividend distributions to investors.
To remain updated on any changes in financials or dividend disbursements, investors should closely observe the company's performance in the coming quarters.
\To stay up-to-date with the companies that are announcing their dividends, click here to visit our Dividends Calendar.
This article was generated by Benzinga's automated content engine and reviewed by an editor.
Posted In: HSBC PNC


