Nurturing Growth: Boston Props Supports Investors with Growing Earnings
Author: Benzinga Insights | January 30, 2024 11:05am
Today, January 30, 2024, Boston Props (NYSE:BXP) will distribute a dividend payout of $0.98 per share, highlighting an annualized dividend yield of 5.49%. Shareholders who owned the stock before the ex-dividend date on December 28, 2023 will be eligible for this payout.
Boston Props Recent Dividend Payouts
| Ex-Date |
Payments per year |
Dividend |
Yield |
Announced |
Record |
Payable |
| 2023-12-28 |
4 |
$0.98 |
5.49% |
2023-12-18 |
2023-12-29 |
2024-01-30 |
| 2023-09-28 |
4 |
$0.98 |
5.88% |
2023-09-05 |
2023-09-30 |
2023-10-31 |
| 2023-06-29 |
4 |
$0.98 |
7.12% |
2023-06-20 |
2023-06-30 |
2023-07-31 |
| 2023-03-30 |
4 |
$0.98 |
7.67% |
2023-03-20 |
2023-03-31 |
2023-04-28 |
| 2022-12-29 |
4 |
$0.98 |
5.83% |
2022-12-19 |
2022-12-30 |
2023-01-30 |
| 2022-09-29 |
4 |
$0.98 |
4.74% |
2022-09-16 |
2022-09-30 |
2022-10-31 |
| 2022-06-29 |
4 |
$0.98 |
4.3% |
2022-06-14 |
2022-06-30 |
2022-07-29 |
| 2022-03-30 |
4 |
$0.98 |
3.15% |
2022-03-21 |
2022-03-31 |
2022-04-29 |
| 2021-12-30 |
4 |
$0.98 |
3.43% |
2021-12-20 |
2021-12-31 |
2022-01-28 |
| 2021-09-29 |
4 |
$0.98 |
3.54% |
2021-09-14 |
2021-09-30 |
2021-10-29 |
| 2021-06-29 |
4 |
$0.98 |
3.18% |
2021-06-14 |
2021-06-30 |
2021-07-30 |
| 2021-03-30 |
4 |
$0.98 |
3.69% |
2021-03-18 |
2021-03-31 |
2021-04-30 |
Boston Props's dividend yield falls in the middle range when compared to its industry peers, with Office Props IT (NASDAQ:OPI) having the highest annualized dividend yield at 20.65%.
Analyzing Boston Props Financial Health
Companies that pay out steady cash dividends are attractive to income-seeking investors, and companies that are financially healthy tend to maintain their dividend payout schedule. For this reason, investors can find it insightful to see if a company has been increasing or decreasing their dividend payout schedule and if their earnings are growing.
YoY Growth in Dividend Per Share
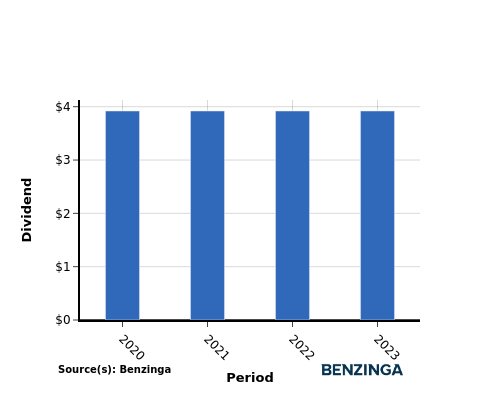
Throughout the period of 2020 to 2023, the company maintained a steady dividend per share of $3.92. This demonstrates the company's commitment to a stable dividend policy, which can be reassuring for investors looking for reliable income sources.
YoY Earnings Growth For Boston Props
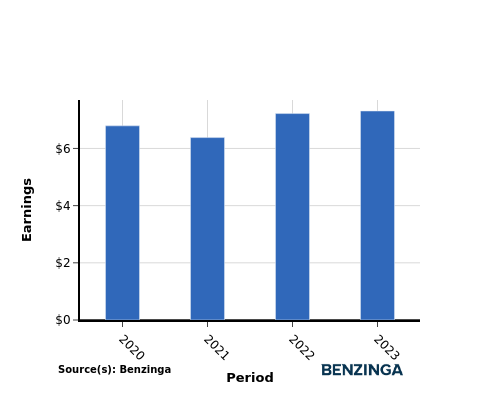
From 2020 to 2023, Boston Props experienced a growth in earnings per share, with an increase from $6.79 to $7.31. This positive earnings trend indicates the company's potential to enhance their cash dividend payout, which can benefit income-seeking investors.
Recap
This article provides an in-depth analysis of Boston Props's recent dividend distribution and the impact it has on shareholders. The company is currently distributing a dividend of $0.98 per share, resulting in an annualized dividend yield of 5.49%.
Boston Props's dividend yield falls in the middle range when compared to its industry peers, with Office Props IT having the highest annualized dividend yield at 20.65%.
Despite no adjustment in the dividend per share over the period of 2020 to 2023, the consistent growth in earnings per share for Boston Props indicates a sound financial status, which could enable the company to continue sharing profits with its investors.
Keeping a vigilant eye on the company's performance in the coming quarters will allow investors to stay current with any variations in financials or dividend disbursements.
[See current stock movements Boston Props on Benzinga.](https://www.benzinga.com/quote/Boston Props (NYSE: BXP))
This article was generated by Benzinga's automated content engine and reviewed by an editor.
Posted In: BXP OPI


