Winnebago Industries Empowers Investors with Solid Returns and Fueling Shareholder Value
Author: Benzinga Insights | January 26, 2024 11:05am
At the end of today, January 26, 2024, Winnebago Industries (NYSE:WGO) will distribute a dividend payout of $0.31 per share, translating to an annualized dividend yield of 1.68%. Shareholders who held the stock before the ex-dividend date on January 11, 2024 will benefit from this payout.
Winnebago Industries Recent Dividend Payouts
| Ex-Date |
Payments per year |
Dividend |
Yield |
Announced |
Record |
Payable |
| 2024-01-11 |
4 |
$0.31 |
1.68% |
2023-12-15 |
2024-01-12 |
2024-01-26 |
| 2023-09-12 |
4 |
$0.31 |
1.93% |
2023-08-16 |
2023-09-13 |
2023-09-27 |
| 2023-06-13 |
4 |
$0.27 |
1.96% |
2023-05-17 |
2023-06-14 |
2023-06-28 |
| 2023-04-11 |
4 |
$0.27 |
1.88% |
2023-03-15 |
2023-04-12 |
2023-04-26 |
| 2023-01-10 |
4 |
$0.27 |
1.91% |
2022-12-14 |
2023-01-11 |
2023-01-25 |
| 2022-09-13 |
4 |
$0.27 |
1.63% |
2022-08-17 |
2022-09-14 |
2022-09-28 |
| 2022-06-07 |
4 |
$0.18 |
1.36% |
2022-05-18 |
2022-06-08 |
2022-06-29 |
| 2022-04-12 |
4 |
$0.18 |
1.22% |
2022-03-16 |
2022-04-13 |
2022-04-27 |
| 2022-01-11 |
4 |
$0.18 |
1.03% |
2021-12-15 |
2022-01-12 |
2022-01-26 |
| 2021-09-14 |
4 |
$0.18 |
1.01% |
2021-08-18 |
2021-09-15 |
2021-09-29 |
| 2021-06-15 |
4 |
$0.12 |
0.68% |
2021-05-19 |
2021-06-16 |
2021-06-30 |
| 2021-04-13 |
4 |
$0.12 |
0.56% |
2021-03-17 |
2021-04-14 |
2021-04-28 |
Winnebago Industries's dividend yield falls in the middle range when compared to its industry peers, with Ford Motor (NYSE:F) having the highest annualized dividend yield at 5.29%.
Analyzing Winnebago Industries Financial Health
Companies that pay out steady cash dividends are attractive to income-seeking investors, and companies that are financially healthy tend to maintain their dividend payout schedule. For this reason, investors can find it insightful to see if a company has been increasing or decreasing their dividend payout schedule and if their earnings are growing.
YoY Growth in Dividend Per Share
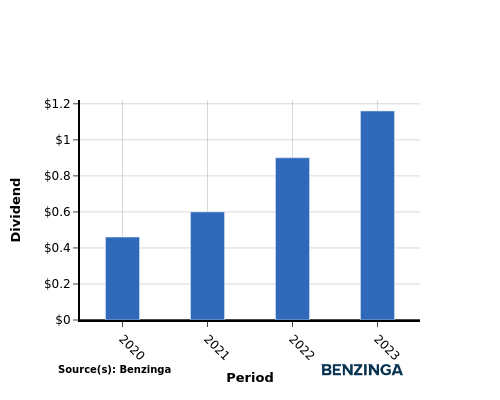
Investors witnessed an upward trajectory in the company's dividend per share between 2020 and 2023. The dividend per share rose from $0.46 to $1.16, indicating the company's dedication to enhancing shareholder value through increased dividends.
YoY Earnings Growth For Winnebago Industries
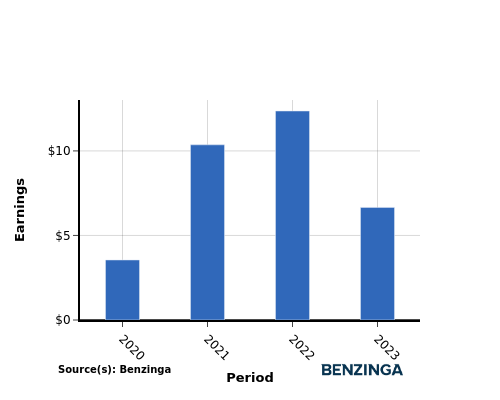
The earnings chart illustrates an increase in Winnebago Industries's earnings per share, from $3.55 in 2020 to $6.66 in 2023. This positive earnings growth provides income-seeking investors with optimism, as it suggests potential for higher cash dividend payouts in the future.
Recap
This article takes an in-depth look at Winnebago Industries's recent dividend payout and its implications for shareholders. The company is currently distributing a dividend of $0.31 per share today, translating to an annualized dividend yield of 1.68%.
Winnebago Industries's dividend yield falls in the middle range when compared to its industry peers, with Ford Motor having the highest annualized dividend yield at 5.29%.
The increase in both dividend per share and earnings per share from 2020 to 2023 for Winnebago Industries indicates a positive financial trend, suggesting their capacity to continue distributing profits to shareholders.
To stay informed about changes in financials or dividend disbursements, investors should pay close attention to the company's performance in the upcoming quarters.
[Track real-time stock fluctuations for Winnebago Industries on Benzinga.](https://www.benzinga.com/quote/Winnebago Industries (NYSE: WGO))
This article was generated by Benzinga's automated content engine and reviewed by an editor.
Posted In: F WGO


