Empowering Shareholders with Growth: CVB Financial Enhances Performance and Reports Rising Profits
Author: Benzinga Insights | January 22, 2024 11:05am
At the end of today, January 22, 2024, CVB Financial (NASDAQ:CVBF) will distribute a dividend payout of $0.20 per share, translating to an annualized dividend yield of 3.86%. Shareholders who held the stock before the ex-dividend date on January 04, 2024 will benefit from this payout.
CVB Financial Recent Dividend Payouts
| Ex-Date |
Payments per year |
Dividend |
Yield |
Announced |
Record |
Payable |
| 2024-01-04 |
4 |
$0.2 |
3.86% |
2023-12-20 |
2024-01-05 |
2024-01-22 |
| 2023-10-03 |
4 |
$0.2 |
4.76% |
2023-09-20 |
2023-10-04 |
2023-10-19 |
| 2023-07-05 |
4 |
$0.2 |
5.59% |
2023-06-21 |
2023-07-06 |
2023-07-20 |
| 2023-04-04 |
4 |
$0.2 |
4.24% |
2023-03-22 |
2023-04-05 |
2023-04-19 |
| 2022-12-28 |
4 |
$0.2 |
3.02% |
2022-12-14 |
2022-12-29 |
2023-01-13 |
| 2022-10-04 |
4 |
$0.2 |
2.97% |
2022-09-21 |
2022-10-05 |
2022-10-20 |
| 2022-06-29 |
4 |
$0.19 |
3.19% |
2022-06-15 |
2022-06-30 |
2022-07-15 |
| 2022-04-05 |
4 |
$0.18 |
3.07% |
2022-03-23 |
2022-04-06 |
2022-04-20 |
| 2021-12-28 |
4 |
$0.18 |
3.38% |
2021-12-15 |
2021-12-29 |
2022-01-12 |
| 2021-10-05 |
4 |
$0.18 |
3.79% |
2021-09-22 |
2021-10-06 |
2021-10-21 |
| 2021-06-29 |
4 |
$0.18 |
3.24% |
2021-06-16 |
2021-06-30 |
2021-07-15 |
| 2021-03-30 |
4 |
$0.18 |
3.03% |
2021-03-17 |
2021-03-31 |
2021-04-14 |
With a dividend yield that places it neither at the top nor the bottom, CVB Financial finds itself in the middle among its industry peers, while First Interstate BancSys (NASDAQ:FIBK) boasts the highest annualized dividend yield at 6.45%.
Analyzing CVB Financial Financial Health
Companies that pay out steady cash dividends are attractive to income-seeking investors, and companies that are financially healthy tend to maintain their dividend payout schedule. For this reason, investors can find it insightful to see if a company has been increasing or decreasing their dividend payout schedule and if their earnings are growing.
YoY Growth in Dividend Per Share
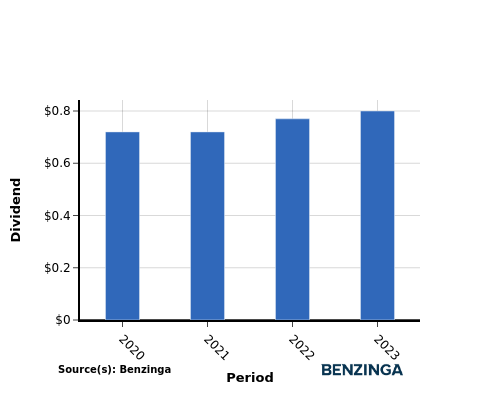
Investors witnessed an upward trajectory in the company's dividend per share between 2020 and 2023. The dividend per share rose from $0.72 to $0.80, indicating the company's dedication to enhancing shareholder value through increased dividends.
YoY Earnings Growth For CVB Financial
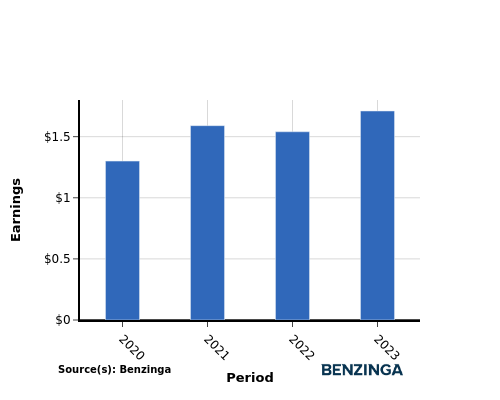
The earnings chart illustrates an increase in CVB Financial's earnings per share, from $1.30 in 2020 to $1.71 in 2023. This positive earnings growth provides income-seeking investors with optimism, as it suggests potential for higher cash dividend payouts in the future.
Recap
This article provides an in-depth analysis of CVB Financial's recent dividend distribution and the impact it has on shareholders. The company is currently distributing a dividend of $0.20 per share, resulting in an annualized dividend yield of 3.86%.
With a dividend yield that places it neither at the top nor the bottom, CVB Financial finds itself in the middle among its industry peers, while First Interstate BancSys boasts the highest annualized dividend yield at 6.45%.
The increase in both dividend per share and earnings per share from 2020 to 2023 for CVB Financial indicates a positive financial trend, suggesting their capacity to continue distributing profits to shareholders.
Keeping a vigilant eye on the company's performance in the coming quarters will allow investors to stay current with any variations in financials or dividend disbursements.
\To stay up-to-date with the companies that are announcing their dividends, click here to visit our Dividends Calendar.
This article was generated by Benzinga's automated content engine and reviewed by an editor.
Posted In: CVBF FIBK


