The Analyst Landscape: 4 Takes On Xometry
Author: Benzinga Insights | January 22, 2024 09:01am
In the preceding three months, 4 analysts have released ratings for Xometry (NASDAQ:XMTR), presenting a wide array of perspectives from bullish to bearish.
In the table below, you'll find a summary of their recent ratings, revealing the shifting sentiments over the past 30 days and comparing them to the previous months.
|
Bullish |
Somewhat Bullish |
Indifferent |
Somewhat Bearish |
Bearish |
| Total Ratings |
2 |
1 |
1 |
0 |
0 |
| Last 30D |
1 |
0 |
0 |
0 |
0 |
| 1M Ago |
1 |
1 |
0 |
0 |
0 |
| 2M Ago |
0 |
0 |
0 |
0 |
0 |
| 3M Ago |
0 |
0 |
1 |
0 |
0 |
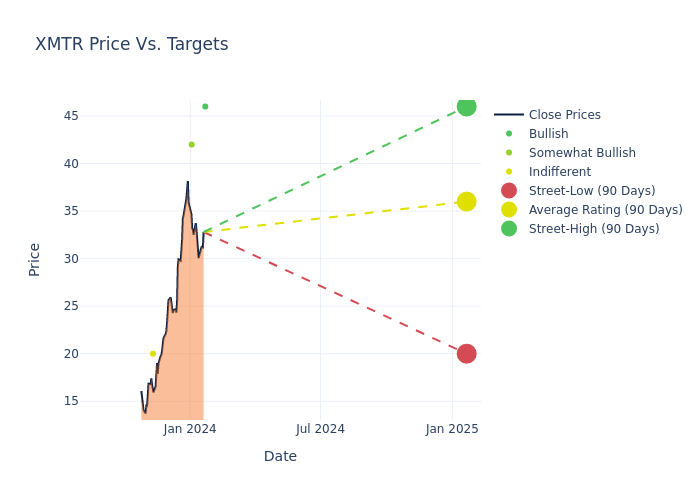
Providing deeper insights, analysts have established 12-month price targets, indicating an average target of $38.5, along with a high estimate of $46.00 and a low estimate of $20.00. This current average reflects an increase of 46.67% from the previous average price target of $26.25.
Decoding Analyst Ratings: A Detailed Look
A clear picture of Xometry's perception among financial experts is painted with a thorough analysis of recent analyst actions. The summary below outlines key analysts, their recent evaluations, and adjustments to ratings and price targets.
| Analyst |
Analyst Firm |
Action Taken |
Rating |
Current Price Target |
Prior Price Target |
| Bruno Montanari |
Goldman Sachs |
Raises |
Buy |
$46.00 |
$29.00 |
| Bruno Montanari |
Goldman Sachs |
Raises |
Buy |
$46.00 |
$29.00 |
| Nicholas Jones |
JMP Securities |
Raises |
Market Outperform |
$42.00 |
$26.00 |
| Matthew Hedberg |
RBC Capital |
Lowers |
Sector Perform |
$20.00 |
$21.00 |
Key Insights:
- Action Taken: In response to dynamic market conditions and company performance, analysts update their recommendations. Whether they 'Maintain', 'Raise', or 'Lower' their stance, it signifies their reaction to recent developments related to Xometry. This insight gives a snapshot of analysts' perspectives on the current state of the company.
- Rating: Delving into assessments, analysts assign qualitative values, from 'Outperform' to 'Underperform'. These ratings communicate expectations for the relative performance of Xometry compared to the broader market.
- Price Targets: Analysts explore the dynamics of price targets, providing estimates for the future value of Xometry's stock. This examination reveals shifts in analysts' expectations over time.
Analyzing these analyst evaluations alongside relevant financial metrics can provide a comprehensive view of Xometry's market position. Stay informed and make data-driven decisions with the assistance of our Ratings Table.
Stay up to date on Xometry analyst ratings.
If you are interested in following small-cap stock news and performance you can start by tracking it here.
Delving into Xometry's Background
Xometry Inc is engaged in providing AI-enabled manufacturing equipment. Its buyers include engineers, product designers, procurement and supply chain personnel, inventors, and business owners. The manufacturing processes offered by the company include CNC Machining, Injection Molding, Urethane Casting, 3D Printing, and Die Casting. The company is organized into two segments referred to as: (1) the U.S. and (2) International. The majority of the revenue is earned from the U.S. segment.
Unraveling the Financial Story of Xometry
Market Capitalization Perspectives: The company's market capitalization falls below industry averages, signaling a relatively smaller size compared to peers. This positioning may be influenced by factors such as perceived growth potential or operational scale.
Revenue Growth: Xometry displayed positive results in 3 months. As of 30 September, 2023, the company achieved a solid revenue growth rate of approximately 14.83%. This indicates a notable increase in the company's top-line earnings. As compared to competitors, the company surpassed expectations with a growth rate higher than the average among peers in the Industrials sector.
Net Margin: Xometry's net margin lags behind industry averages, suggesting challenges in maintaining strong profitability. With a net margin of -10.11%, the company may face hurdles in effective cost management.
Return on Equity (ROE): Xometry's ROE is below industry averages, indicating potential challenges in efficiently utilizing equity capital. With an ROE of -3.55%, the company may face hurdles in achieving optimal financial returns.
Return on Assets (ROA): Xometry's ROA lags behind industry averages, suggesting challenges in maximizing returns from its assets. With an ROA of -1.71%, the company may face hurdles in achieving optimal financial performance.
Debt Management: Xometry's debt-to-equity ratio is below industry norms, indicating a sound financial structure with a ratio of 0.9.
The Basics of Analyst Ratings
Analysts are specialists within banking and financial systems that typically report for specific stocks or within defined sectors. These people research company financial statements, sit in conference calls and meetings, and speak with relevant insiders to determine what are known as analyst ratings for stocks. Typically, analysts will rate each stock once a quarter.
In addition to their assessments, some analysts extend their insights by offering predictions for key metrics such as earnings, revenue, and growth estimates. This supplementary information provides further guidance for traders. It is crucial to recognize that, despite their specialization, analysts are human and can only provide forecasts based on their beliefs.
This article was generated by Benzinga's automated content engine and reviewed by an editor.
Posted In: XMTR