A Glimpse Into The Expert Outlook On Hayward Holdings Through 6 Analysts
Author: Benzinga Insights | January 11, 2024 10:00am
Providing a diverse range of perspectives from bullish to bearish, 6 analysts have published ratings on Hayward Holdings (NYSE:HAYW) in the last three months.
The table below provides a concise overview of recent ratings by analysts, offering insights into the changing sentiments over the past 30 days and drawing comparisons with the preceding months for a holistic perspective.
|
Bullish |
Somewhat Bullish |
Indifferent |
Somewhat Bearish |
Bearish |
| Total Ratings |
1 |
1 |
4 |
0 |
0 |
| Last 30D |
0 |
0 |
1 |
0 |
0 |
| 1M Ago |
0 |
0 |
1 |
0 |
0 |
| 2M Ago |
0 |
0 |
0 |
0 |
0 |
| 3M Ago |
1 |
1 |
2 |
0 |
0 |
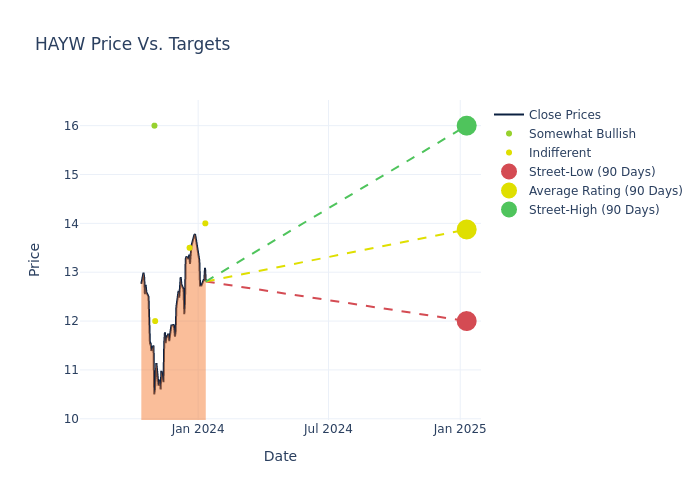
In the assessment of 12-month price targets, analysts unveil insights for Hayward Holdings, presenting an average target of $13.75, a high estimate of $16.00, and a low estimate of $12.00. Observing a downward trend, the current average is 6.46% lower than the prior average price target of $14.70.
Investigating Analyst Ratings: An Elaborate Study
The standing of Hayward Holdings among financial experts becomes clear with a thorough analysis of recent analyst actions. The summary below outlines key analysts, their recent evaluations, and adjustments to ratings and price targets.
| Analyst |
Analyst Firm |
Action Taken |
Rating |
Current Price Target |
Prior Price Target |
| Saree Boroditsky |
Jefferies |
Announces |
Hold |
$14.00 |
- |
| W. Andrew Carter |
Stifel |
Raises |
Hold |
$13.50 |
$13.00 |
| Brian Lee |
Goldman Sachs |
Lowers |
Neutral |
$12.00 |
$13.50 |
| Brian Lee |
Goldman Sachs |
Lowers |
Neutral |
$12.00 |
$13.50 |
| Jeffrey Hammond |
Keybanc |
Lowers |
Overweight |
$16.00 |
$17.00 |
| W. Andrew Carter |
Stifel |
Lowers |
Buy |
$15.00 |
$16.50 |
Key Insights:
- Action Taken: Analysts respond to changes in market conditions and company performance, frequently updating their recommendations. Whether they 'Maintain', 'Raise' or 'Lower' their stance, it reflects their reaction to recent developments related to Hayward Holdings. This information offers a snapshot of how analysts perceive the current state of the company.
- Rating: Analysts unravel qualitative evaluations for stocks, ranging from 'Outperform' to 'Underperform'. These ratings offer insights into expectations for the relative performance of Hayward Holdings compared to the broader market.
- Price Targets: Analysts set price targets as an estimate of a stock's future value. Comparing the current and prior price targets provides insight into how analysts' expectations have changed over time. This information can be valuable for investors seeking to understand consensus views on the stock's potential future performance.
Considering these analyst evaluations in conjunction with other financial indicators can offer a comprehensive understanding of Hayward Holdings's market position. Stay informed and make well-informed decisions with our Ratings Table.
Stay up to date on Hayward Holdings analyst ratings.
About Hayward Holdings
Hayward Holdings is a leading manufacturer of energy-efficient swimming pool equipment and pool automation systems. The company offers a wide range of pool equipment, including pumps, filters, heaters, LED lights, and sanitization. Headquartered in Charlotte, North Carolina, the company has around 2,000 full-time employees. Hayward generated approximately $1.3 billion in revenue in 2022.
Hayward Holdings: Financial Performance Dissected
Market Capitalization Analysis: Below industry benchmarks, the company's market capitalization reflects a smaller scale relative to peers. This could be attributed to factors such as growth expectations or operational capacity.
Negative Revenue Trend: Examining Hayward Holdings's financials over 3 months reveals challenges. As of 30 September, 2023, the company experienced a decline of approximately -10.18% in revenue growth, reflecting a decrease in top-line earnings. As compared to its peers, the revenue growth lags behind its industry peers. The company achieved a growth rate lower than the average among peers in Industrials sector.
Net Margin: The company's net margin is below industry benchmarks, signaling potential difficulties in achieving strong profitability. With a net margin of 5.35%, the company may need to address challenges in effective cost control.
Return on Equity (ROE): Hayward Holdings's ROE falls below industry averages, indicating challenges in efficiently using equity capital. With an ROE of 0.92%, the company may face hurdles in generating optimal returns for shareholders.
Return on Assets (ROA): Hayward Holdings's ROA is below industry standards, pointing towards difficulties in efficiently utilizing assets. With an ROA of 0.41%, the company may encounter challenges in delivering satisfactory returns from its assets.
Debt Management: The company maintains a balanced debt approach with a debt-to-equity ratio below industry norms, standing at 0.86.
What Are Analyst Ratings?
Ratings come from analysts, or specialists within banking and financial systems that report for specific stocks or defined sectors (typically once per quarter for each stock). Analysts usually derive their information from company conference calls and meetings, financial statements, and conversations with important insiders to reach their decisions.
Some analysts publish their predictions for metrics such as growth estimates, earnings, and revenue to provide additional guidance with their ratings. When using analyst ratings, it is important to keep in mind that stock and sector analysts are also human and are only offering their opinions to investors.
If you want to keep track of which analysts are outperforming others, you can view updated analyst ratings along withanalyst success scores in Benzinga Pro.
This article was generated by Benzinga's automated content engine and reviewed by an editor.
Posted In: HAYW