Critical Insights From Realty Income Analyst Ratings: What You Need To Know
Author: Benzinga Insights | January 10, 2024 05:01pm
6 analysts have expressed a variety of opinions on Realty Income (NYSE:O) over the past quarter, offering a diverse set of opinions from bullish to bearish.
The table below offers a condensed view of their recent ratings, showcasing the changing sentiments over the past 30 days and comparing them to the preceding months.
|
Bullish |
Somewhat Bullish |
Indifferent |
Somewhat Bearish |
Bearish |
| Total Ratings |
2 |
3 |
1 |
0 |
0 |
| Last 30D |
1 |
0 |
0 |
0 |
0 |
| 1M Ago |
0 |
1 |
0 |
0 |
0 |
| 2M Ago |
0 |
1 |
0 |
0 |
0 |
| 3M Ago |
1 |
1 |
1 |
0 |
0 |
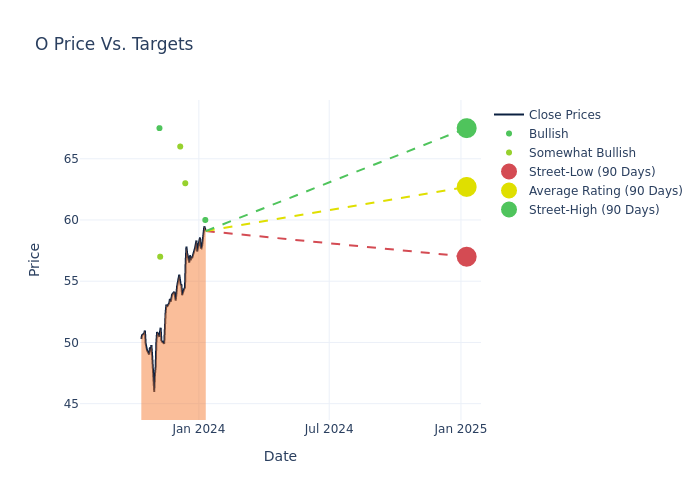
Analysts have set 12-month price targets for Realty Income, revealing an average target of $60.25, a high estimate of $67.50, and a low estimate of $48.00. Observing a downward trend, the current average is 1.42% lower than the prior average price target of $61.12.
Deciphering Analyst Ratings: An In-Depth Analysis
The analysis of recent analyst actions sheds light on the perception of Realty Income by financial experts. The following summary presents key analysts, their recent evaluations, and adjustments to ratings and price targets.
| Analyst |
Analyst Firm |
Action Taken |
Rating |
Current Price Target |
Prior Price Target |
| Vikram Malhorta |
Mizuho |
Raises |
Buy |
$60.00 |
$58.00 |
| Nate Crossett |
Exane BNP Paribas |
Announces |
Outperform |
$63.00 |
- |
| Andrew Rosivach |
Wolfe Research |
Announces |
Outperform |
$66.00 |
- |
| Brad Heffern |
RBC Capital |
Raises |
Outperform |
$57.00 |
$56.00 |
| Simon Yarmak |
Stifel |
Lowers |
Buy |
$67.50 |
$69.50 |
| Haendel St. Juste |
Mizuho |
Lowers |
Neutral |
$48.00 |
$61.00 |
Key Insights:
- Action Taken: In response to dynamic market conditions and company performance, analysts update their recommendations. Whether they 'Maintain', 'Raise', or 'Lower' their stance, it signifies their reaction to recent developments related to Realty Income. This insight gives a snapshot of analysts' perspectives on the current state of the company.
- Rating: Analysts assign qualitative assessments to stocks, ranging from 'Outperform' to 'Underperform'. These ratings convey the analysts' expectations for the relative performance of Realty Income compared to the broader market.
- Price Targets: Analysts predict movements in price targets, offering estimates for Realty Income's future value. Examining the current and prior targets offers insights into analysts' evolving expectations.
Understanding these analyst evaluations alongside key financial indicators can offer valuable insights into Realty Income's market standing. Stay informed and make well-considered decisions with our Ratings Table.
Stay up to date on Realty Income analyst ratings.
Unveiling the Story Behind Realty Income
Realty Income owns roughly 13,100 properties, most of which are freestanding, single-tenant, triple-net-leased retail properties. Its properties are located in 49 states and Puerto Rico and are leased to 250 tenants from 47 industries. Recent acquisitions have added industrial, gaming, office, manufacturing, and distribution properties, which make up roughly 17% of revenue.
Unraveling the Financial Story of Realty Income
Market Capitalization: Boasting an elevated market capitalization, the company surpasses industry averages. This signals substantial size and strong market recognition.
Positive Revenue Trend: Examining Realty Income's financials over 3 months reveals a positive narrative. The company achieved a noteworthy revenue growth rate of 24.11% as of 30 September, 2023, showcasing a substantial increase in top-line earnings. When compared to others in the Real Estate sector, the company excelled with a growth rate higher than the average among peers.
Net Margin: The company's net margin is a standout performer, exceeding industry averages. With an impressive net margin of 22.47%, the company showcases strong profitability and effective cost control.
Return on Equity (ROE): Realty Income's ROE is below industry averages, indicating potential challenges in efficiently utilizing equity capital. With an ROE of 0.74%, the company may face hurdles in achieving optimal financial returns.
Return on Assets (ROA): Realty Income's ROA is below industry standards, pointing towards difficulties in efficiently utilizing assets. With an ROA of 0.43%, the company may encounter challenges in delivering satisfactory returns from its assets.
Debt Management: Realty Income's debt-to-equity ratio is below industry norms, indicating a sound financial structure with a ratio of 0.66.
The Significance of Analyst Ratings Explained
Benzinga tracks 150 analyst firms and reports on their stock expectations. Analysts typically arrive at their conclusions by predicting how much money a company will make in the future, usually the upcoming five years, and how risky or predictable that company's revenue streams are.
Analysts attend company conference calls and meetings, research company financial statements, and communicate with insiders to publish their ratings on stocks. Analysts typically rate each stock once per quarter or whenever the company has a major update.
In addition to their assessments, some analysts extend their insights by offering predictions for key metrics such as earnings, revenue, and growth estimates. This supplementary information provides further guidance for traders. It is crucial to recognize that, despite their specialization, analysts are human and can only provide forecasts based on their beliefs.
This article was generated by Benzinga's automated content engine and reviewed by an editor.
Posted In: O