These Developed Markets Outside US Are Getting Bullish: Here's What VEA ETF Technical Chart Shows
Author: Surbhi Jain | January 08, 2024 11:49am
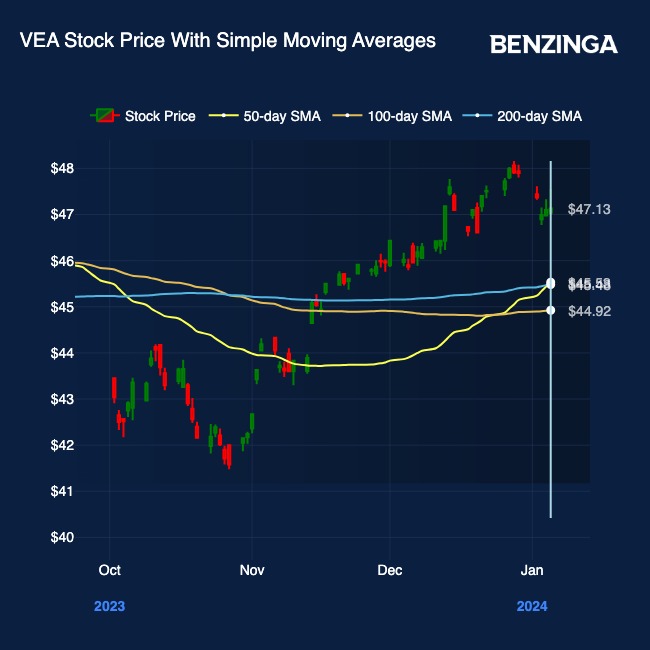
The Vanguard FTSE Developed Markets ETF (NYSE:VEA) just formed a Golden Cross on the technical charts. Developed markets, outside the U.S., hope for a bullish price trend ahead.
The VEA ETF: The VEA ETF tracks the FTSE Developed ex-U.S. All Cap Net Tax (US RIC) Index. It offers exposure to developed markets outside of North America, including:
Europe (~53%)
Japan (20%)
Australia (6%).
In essence, it is an investment vehicle popularly used to get overweight ex-U.S. developed markets.
Currently, 70% of the ETF is invested in large-cap stocks, with the financial sector being the dominating sector at 21.62%.
The VEA ETF trumps the iShares MSCI EAFE ETF (NYSE:EFA) in depth of holdings and cost efficiency. While the VEA is invested across 4,500 holdings, the EFA portfolio is spread across 1,000 holdings. The VEA has an expense ratio of 0.05% versus the EFA which charges 0.35%.
“Japanese stocks remain attractive, given rerating potential driven by corporate governance reforms,” John Bilton, head of Global Multi-Asset Strategy at JPMorgan, said.
For the first quarter of 2024, Bilton expects to see U.K. equity as cheap and supported by valuations and flows.
“It is a defensive market; with a positive gearing towards commodities,” he added.
Wells Fargo has a year-end 2024 target of 2,000-2,200 for the MSCI EAFE Index which tracks the developed markets ex-U.S. and Canada. The investment firm said they “prefer developed-market over emerging-market equities.”
Compelling alternatives to the VEA ETF include: the Vanguard Total International Stock ETF (NASDAQ:VXUS) and the RAFI-weighted InvescoFTSE RAFI Developed Markets ex-U.S. ETF (NYSE:PXF) (which also includes Canadian stocks).
The VEA Chart: The VEA technical price chart indicates a Golden Cross forming. The 50-day SMA can be seen crossing over the 200-day SMA, indicating a bullish trend kicking in.
At a P/E ratio of 12.97, investors in developed markets may find the VEA particularly attractive.