Maximizing Investor Returns: Greenhill & Co Unleashes Growth Potential with Strong Performance
Author: Benzinga Insights | December 27, 2023 11:05am
Today, December 27, 2023, marks an important moment for investors of Greenhill & Co (NYSE:GHL). The company will distribute a dividend payout of $0.10 per share, demonstrating an annualized dividend yield of 2.70%. Remember, only shareholders prior to the ex-dividend date on December 12, 2023 are eligible for this payout.
Greenhill & Co Recent Dividend Payouts
| Ex-Date |
Payments per year |
Dividend |
Yield |
Announced |
Record |
Payable |
| 2023-12-12 |
4 |
$0.1 |
2.7% |
2023-11-09 |
2023-12-13 |
2023-12-27 |
| 2023-09-12 |
4 |
$0.1 |
2.72% |
2023-08-09 |
2023-09-13 |
2023-09-27 |
| 2023-06-06 |
4 |
$0.1 |
5.92% |
2023-05-03 |
2023-06-07 |
2023-06-21 |
| 2023-03-07 |
4 |
$0.1 |
2.89% |
2023-02-01 |
2023-03-08 |
2023-03-22 |
| 2022-12-06 |
4 |
$0.1 |
5.52% |
2022-11-02 |
2022-12-07 |
2022-12-21 |
| 2022-09-13 |
4 |
$0.1 |
4.63% |
2022-08-02 |
2022-09-14 |
2022-09-28 |
| 2022-05-31 |
4 |
$0.1 |
2.94% |
2022-04-27 |
2022-06-01 |
2022-06-15 |
| 2022-03-01 |
4 |
$0.1 |
2.42% |
2022-02-02 |
2022-03-02 |
2022-03-16 |
| 2021-11-30 |
4 |
$0.05 |
1.25% |
2021-11-03 |
2021-12-01 |
2021-12-15 |
| 2021-08-31 |
4 |
$0.05 |
1.25% |
2021-08-03 |
2021-09-01 |
2021-09-15 |
| 2021-06-01 |
4 |
$0.05 |
1.01% |
2021-04-29 |
2021-06-02 |
2021-06-16 |
| 2021-03-02 |
4 |
$0.05 |
1.68% |
2021-02-04 |
2021-03-03 |
2021-03-17 |
Greenhill & Co's dividend yield falls in the middle range when compared to its industry peers, with B. Riley Financial (NASDAQ:RILY) having the highest annualized dividend yield at 20.70%.
Analyzing Greenhill & Co Financial Health
Companies that pay out steady cash dividends are attractive to income-seeking investors, and companies that are financially healthy tend to maintain their dividend payout schedule. For this reason, investors can find it insightful to see if a company has been increasing or decreasing their dividend payout schedule and if their earnings are growing.
YoY Growth in Dividend Per Share

The company demonstrated a positive dividend growth pattern from 2019 to 2022, with the dividend per share rising from $0.20 to $0.40. This signifies the company's commitment to consistently increasing shareholder dividends.
YoY Earnings Growth For Greenhill & Co
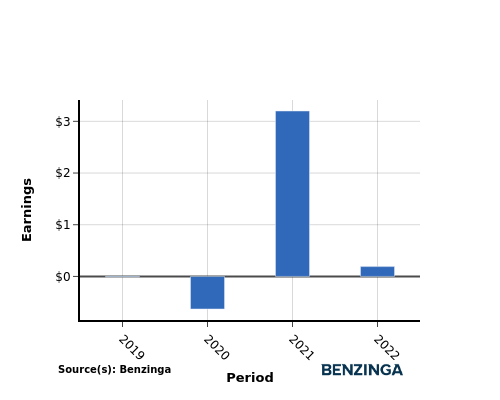
From 2019 to 2022, Greenhill & Co has demonstrated an upward trend in earnings, with earnings per share rising from $-0.01 to $0.19. This positive earnings growth bodes well for investors looking to generate income through cash dividend payouts.
Recap
This article takes an in-depth look at Greenhill & Co's recent dividend payout and its implications for shareholders. The company is currently distributing a dividend of $0.10 per share today, translating to an annualized dividend yield of 2.70%.
Greenhill & Co's dividend yield falls in the middle range when compared to its industry peers, with B. Riley Financial having the highest annualized dividend yield at 20.70%.
The upward trend in dividend per share and earnings per share for Greenhill & Co from 2019 to 2022 reflects a strong financial position, supporting the company's ability to consistently distribute profits to their investors.
Keeping a vigilant eye on the company's performance in the coming quarters will allow investors to stay current with any variations in financials or dividend disbursements.
\To keep track of which companies are distributing dividends, click here to visit our Dividends Calendar.
This article was generated by Benzinga's automated content engine and reviewed by an editor.
Posted In: GHL RILY


