Exceeding Expectations: Flushing Financial Achieves Strong Performance and Rewards Investors
Author: Benzinga Insights | December 22, 2023 11:05am
By the close of today, December 22, 2023, Flushing Financial (NASDAQ:FFIC) will issue a dividend payout of $0.22 per share, resulting in an annualized dividend yield of 6.16%. This payout is exclusively for shareholders who held the stock before the ex-dividend date on December 07, 2023.
Flushing Financial Recent Dividend Payouts
| Ex-Date |
Payments per year |
Dividend |
Yield |
Announced |
Record |
Payable |
| 2023-12-07 |
4 |
$0.22 |
6.16% |
2023-11-21 |
2023-12-08 |
2023-12-22 |
| 2023-09-07 |
4 |
$0.22 |
5.74% |
2023-08-15 |
2023-09-08 |
2023-09-29 |
| 2023-06-01 |
4 |
$0.22 |
9.02% |
2023-05-16 |
2023-06-02 |
2023-06-23 |
| 2023-03-09 |
4 |
$0.22 |
4.48% |
2023-02-23 |
2023-03-10 |
2023-03-31 |
| 2022-12-08 |
4 |
$0.22 |
4.22% |
2022-11-22 |
2022-12-09 |
2022-12-23 |
| 2022-09-01 |
4 |
$0.22 |
3.86% |
2022-08-16 |
2022-09-02 |
2022-09-30 |
| 2022-06-02 |
4 |
$0.22 |
4.01% |
2022-05-17 |
2022-06-03 |
2022-06-24 |
| 2022-03-10 |
4 |
$0.22 |
3.68% |
2022-02-23 |
2022-03-11 |
2022-03-25 |
| 2021-12-09 |
4 |
$0.21 |
3.47% |
2021-11-23 |
2021-12-10 |
2021-12-31 |
| 2021-09-02 |
4 |
$0.21 |
3.68% |
2021-08-17 |
2021-09-03 |
2021-09-24 |
| 2021-06-03 |
4 |
$0.21 |
3.52% |
2021-05-18 |
2021-06-04 |
2021-06-25 |
| 2021-03-11 |
4 |
$0.21 |
3.97% |
2021-02-23 |
2021-03-12 |
2021-03-26 |
Flushing Financial is the leader in terms of dividend yield compared to its industry peers, with Central Pacific Financial (NYSE:CPF) having the highest annualized dividend yield at 5.27%.
Analyzing Flushing Financial Financial Health
Companies that pay out steady cash dividends are attractive to income-seeking investors, and companies that are financially healthy tend to maintain their dividend payout schedule. For this reason, investors can find it insightful to see if a company has been increasing or decreasing their dividend payout schedule and if their earnings are growing.
YoY Growth in Dividend Per Share
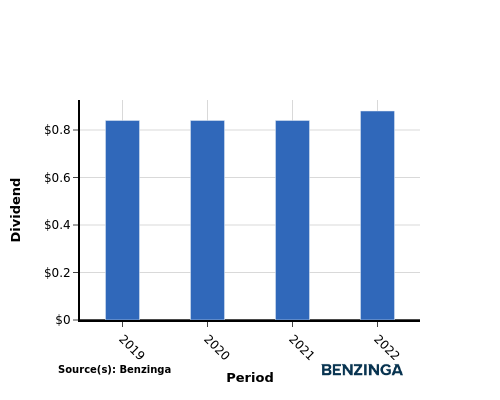
From 2019 to 2022, the company's dividend per share showed a positive trend, increasing steadily from $0.84 in 2019 to $0.88 in 2022. This demonstrates the company's commitment to rewarding shareholders by consistently raising dividends.
YoY Earnings Growth For Flushing Financial
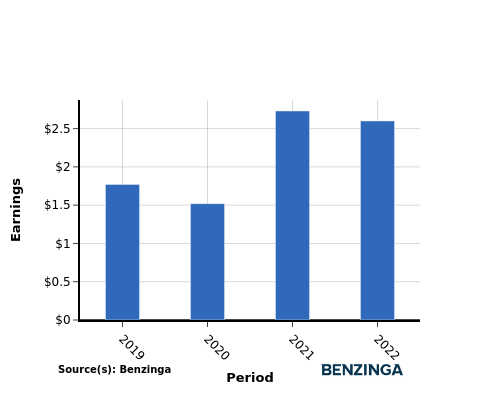
The earnings chart above shows that from 2019 to 2022, Flushing Financial has experienced an increase in their earnings from $1.77 per share to $2.60 per share. This positive earnings trend is promising for income-seeking investors as it suggests that the company has more potential to increase its cash dividend payout if the trend continues.
Recap
In this article, we explore the recent dividend payout of Flushing Financial and its significance for shareholders. The company has decided to distribute a dividend of $0.22 per share today, which equates to an annualized dividend yield of 6.16%.
Flushing Financial is the leader in terms of dividend yield compared to its industry peers, with Central Pacific Financial having the highest annualized dividend yield at 5.27%.
The increase in both dividend per share and earnings per share from 2019 to 2022 for Flushing Financial indicates a positive financial trend, suggesting their capacity to continue distributing profits to shareholders.
Keeping a close watch on the company's performance in the coming quarters will enable investors to stay abreast of any modifications in financials or dividend disbursements.
[Monitor live stock price updates for Flushing Financial on Benzinga.](https://www.benzinga.com/quote/Flushing Financial (NASDAQ: FFIC))
This article was generated by Benzinga's automated content engine and reviewed by an editor.
Posted In: CPF FFIC


