In-Depth Examination Of 5 Analyst Recommendations For Universal Technical
Author: Benzinga Insights | December 20, 2023 09:00am
Throughout the last three months, 5 analysts have evaluated Universal Technical (NYSE:UTI), offering a diverse set of opinions from bullish to bearish.
The following table provides a quick overview of their recent ratings, highlighting the changing sentiments over the past 30 days and comparing them to the preceding months.
|
Bullish |
Somewhat Bullish |
Indifferent |
Somewhat Bearish |
Bearish |
| Total Ratings |
4 |
1 |
0 |
0 |
0 |
| Last 30D |
1 |
0 |
0 |
0 |
0 |
| 1M Ago |
0 |
0 |
0 |
0 |
0 |
| 2M Ago |
3 |
1 |
0 |
0 |
0 |
| 3M Ago |
0 |
0 |
0 |
0 |
0 |
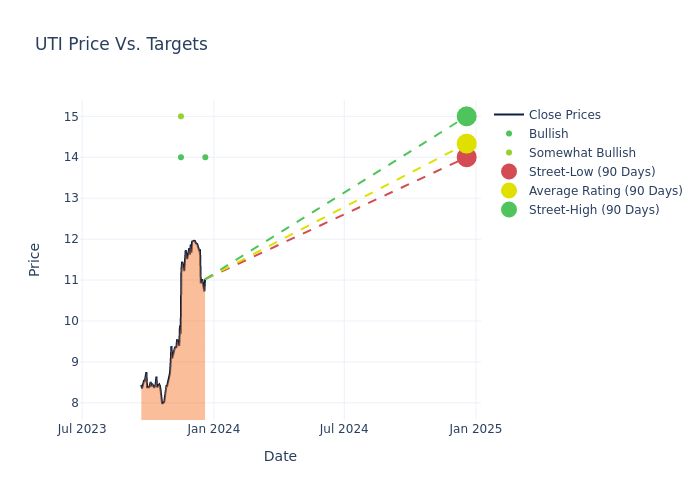
Analysts' evaluations of 12-month price targets offer additional insights, showcasing an average target of $13.6, with a high estimate of $15.00 and a low estimate of $11.00. Observing a 31.66% increase, the current average has risen from the previous average price target of $10.33.
Diving into Analyst Ratings: An In-Depth Exploration
An in-depth analysis of recent analyst actions unveils how financial experts perceive Universal Technical. The following summary outlines key analysts, their recent evaluations, and adjustments to ratings and price targets.
| Analyst |
Analyst Firm |
Action Taken |
Rating |
Current Price Target |
Prior Price Target |
| Steve Frankel |
Rosenblatt |
Announces |
Buy |
$14.00 |
- |
| Alexander Paris |
Barrington Research |
Raises |
Outperform |
$15.00 |
$10.00 |
| Raj Sharma |
B. Riley Securities |
Raises |
Buy |
$14.00 |
$10.00 |
| Steve Frankel |
Rosenblatt |
Raises |
Buy |
$14.00 |
$11.00 |
| Steve Frankel |
Rosenblatt |
Maintains |
Buy |
$11.00 |
- |
Key Insights:
- Action Taken: Analysts adapt their recommendations to changing market conditions and company performance. Whether they 'Maintain', 'Raise' or 'Lower' their stance, it reflects their response to recent developments related to Universal Technical. This information provides a snapshot of how analysts perceive the current state of the company.
- Rating: Analysts assign qualitative assessments to stocks, ranging from 'Outperform' to 'Underperform'. These ratings convey the analysts' expectations for the relative performance of Universal Technical compared to the broader market.
- Price Targets: Delving into movements, analysts provide estimates for the future value of Universal Technical's stock. This analysis reveals shifts in analysts' expectations over time.
Analyzing these analyst evaluations alongside relevant financial metrics can provide a comprehensive view of Universal Technical's market position. Stay informed and make data-driven decisions with the assistance of our Ratings Table.
Stay up to date on Universal Technical analyst ratings.
If you are interested in following small-cap stock news and performance you can start by tracking it here.
Discovering Universal Technical: A Closer Look
Universal Technical Institute Inc is an educational institution. It provides undergraduate degree, as well as certificate programs for technicians in the automotive, diesel, collision repair, motorcycle and marine fields. The company's reportable segment includes Universal Technical Institute (UTI) and Concorde Career Colleges. Majority of the revenue is generated from UTI segment which provides different kinds of degree and non-degree transportation and skilled trades technical training programs under brands such as Universal Technical Institute, Motorcycle Mechanics Institute, Marine Mechanics Institute and others. It also provides dealer technician training or instructor staffing services to manufacturers.
Financial Insights: Universal Technical
Market Capitalization Analysis: The company's market capitalization is below the industry average, suggesting that it is relatively smaller compared to peers. This could be due to various factors, including perceived growth potential or operational scale.
Revenue Growth: Universal Technical's remarkable performance in 3 months is evident. As of 30 September, 2023, the company achieved an impressive revenue growth rate of 53.92%. This signifies a substantial increase in the company's top-line earnings. When compared to others in the Consumer Discretionary sector, the company excelled with a growth rate higher than the average among peers.
Net Margin: Universal Technical's financial strength is reflected in its exceptional net margin, which exceeds industry averages. With a remarkable net margin of 1.99%, the company showcases strong profitability and effective cost management.
Return on Equity (ROE): Universal Technical's financial strength is reflected in its exceptional ROE, which exceeds industry averages. With a remarkable ROE of 1.52%, the company showcases efficient use of equity capital and strong financial health.
Return on Assets (ROA): Universal Technical's ROA surpasses industry standards, highlighting the company's exceptional financial performance. With an impressive 0.47% ROA, the company effectively utilizes its assets for optimal returns.
Debt Management: Universal Technical's debt-to-equity ratio surpasses industry norms, standing at 1.55. This suggests the company carries a substantial amount of debt, posing potential financial challenges.
How Are Analyst Ratings Determined?
Ratings come from analysts, or specialists within banking and financial systems that report for specific stocks or defined sectors (typically once per quarter for each stock). Analysts usually derive their information from company conference calls and meetings, financial statements, and conversations with important insiders to reach their decisions.
Analysts may enhance their evaluations by incorporating forecasts for metrics like growth estimates, earnings, and revenue, delivering additional guidance to investors. It is vital to acknowledge that, although experts in stocks and sectors, analysts are human and express their opinions when providing insights.
This article was generated by Benzinga's automated content engine and reviewed by an editor.
Posted In: UTI