Exceeding Expectations: Radian Group Achieves Strong Performance and Rewards Investors
Author: Benzinga Insights | December 12, 2023 11:05am
Investors eagerly anticipate the dividend payout from Radian Group (NYSE:RDN) on December 12, 2023. With a payout of $0.23 per share and an annualized dividend yield of 3.37%, this reward is exclusively for shareholders who held the stock before the ex-dividend date on November 24, 2023
Radian Group Recent Dividend Payouts
| Ex-Date |
Payments per year |
Dividend |
Yield |
Announced |
Record |
Payable |
| 2023-11-24 |
4 |
$0.23 |
3.37% |
2023-11-15 |
2023-11-27 |
2023-12-12 |
| 2023-08-18 |
4 |
$0.23 |
3.21% |
2023-08-09 |
2023-08-21 |
2023-09-06 |
| 2023-05-26 |
4 |
$0.23 |
3.6% |
2023-05-17 |
2023-05-30 |
2023-06-14 |
| 2023-02-24 |
4 |
$0.23 |
4.07% |
2023-02-15 |
2023-02-27 |
2023-03-15 |
| 2022-11-18 |
4 |
$0.2 |
3.89% |
2022-11-09 |
2022-11-21 |
2022-12-02 |
| 2022-08-19 |
4 |
$0.2 |
3.6% |
2022-08-10 |
2022-08-22 |
2022-09-01 |
| 2022-05-20 |
4 |
$0.2 |
3.75% |
2022-05-11 |
2022-05-23 |
2022-06-03 |
| 2022-02-17 |
4 |
$0.2 |
3.32% |
2022-02-09 |
2022-02-21 |
2022-03-03 |
| 2021-11-19 |
4 |
$0.14 |
2.51% |
2021-11-10 |
2021-11-22 |
2021-12-03 |
| 2021-08-20 |
4 |
$0.14 |
2.42% |
2021-08-11 |
2021-08-23 |
2021-09-02 |
| 2021-05-21 |
4 |
$0.14 |
2.27% |
2021-05-04 |
2021-05-24 |
2021-06-04 |
| 2021-02-19 |
4 |
$0.12 |
2.41% |
2021-02-10 |
2021-02-22 |
2021-03-04 |
With a dividend yield that places it neither at the top nor the bottom, Radian Group finds itself in the middle among its industry peers, while Greystone Housing Impact (NYSE:GHI) boasts the highest annualized dividend yield at 8.97%.
Analyzing Radian Group Financial Health
Companies that pay out steady cash dividends are attractive to income-seeking investors, and companies that are financially healthy tend to maintain their dividend payout schedule. For this reason, investors can find it insightful to see if a company has been increasing or decreasing their dividend payout schedule and if their earnings are growing.
YoY Growth in Dividend Per Share
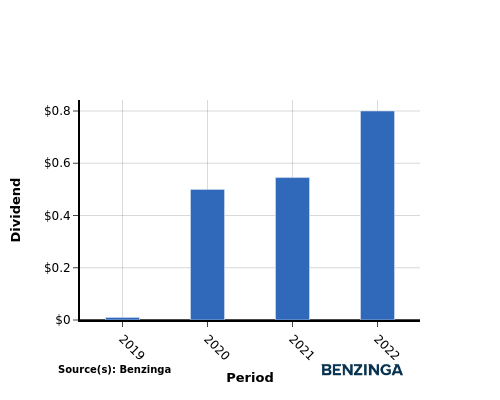
Investors witnessed an upward trajectory in the company's dividend per share between 2019 and 2022. The dividend per share rose from $0.01 to $0.80, indicating the company's dedication to enhancing shareholder value through increased dividends.
YoY Earnings Growth For Radian Group
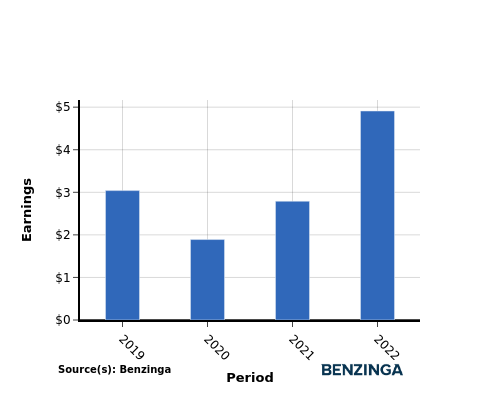
From 2019 to 2022, Radian Group has demonstrated an upward trend in earnings, with earnings per share rising from $3.04 to $4.91. This positive earnings growth bodes well for investors looking to generate income through cash dividend payouts.
Recap
This article takes an in-depth look at Radian Group's recent dividend payout and its implications for shareholders. The company is currently distributing a dividend of $0.23 per share today, translating to an annualized dividend yield of 3.37%.
With a dividend yield that places it neither at the top nor the bottom, Radian Group finds itself in the middle among its industry peers, while Greystone Housing Impact boasts the highest annualized dividend yield at 8.97%.
Given that Radian Group has experienced an increase in dividend per share from 2019 to 2022 along with an increase in earnings per share, it could signal that the company is in good financial standing and that they could be positioned to continue distributing their profits back to their investors.
Investors should closely follow the company's performance in the coming quarters to stay up-to-date on any shifts in financials or dividend disbursements.
\To read more news on Radian Group click here
Click here to visit our Dividends Calendar.
This article was generated by Benzinga's automated content engine and reviewed by an editor.
Posted In: GHI RDN


