Exceeding Expectations: TransUnion Achieves Strong Performance and Rewards Investors
Author: Benzinga Insights | December 04, 2023 11:05am
By the end of today, December 04, 2023, TransUnion (NYSE:TRU) is set to deliver a dividend payout of $0.10 per share, equating to an annualized dividend yield of 0.88%. The company's dividend payout went ex-dividend on November 16, 2023, so only the investors that owned the stock prior to the ex-dividend date will receive this payout.
TransUnion Recent Dividend Payouts
| Ex-Date |
Payments per year |
Dividend |
Yield |
Announced |
Record |
Payable |
| 2023-11-16 |
4 |
$0.1 |
0.88% |
2023-11-03 |
2023-11-17 |
2023-12-04 |
| 2023-08-22 |
4 |
$0.1 |
0.54% |
2023-08-09 |
2023-08-23 |
2023-09-07 |
| 2023-05-18 |
4 |
$0.1 |
0.66% |
2023-05-05 |
2023-05-19 |
2023-06-02 |
| 2023-03-08 |
4 |
$0.1 |
0.63% |
2023-02-23 |
2023-03-09 |
2023-03-24 |
| 2022-11-16 |
4 |
$0.1 |
0.78% |
2022-11-03 |
2022-11-17 |
2022-12-02 |
| 2022-08-24 |
4 |
$0.1 |
0.51% |
2022-08-11 |
2022-08-25 |
2022-09-09 |
| 2022-05-26 |
4 |
$0.1 |
0.47% |
2022-05-13 |
2022-05-27 |
2022-06-10 |
| 2022-03-09 |
4 |
$0.1 |
0.44% |
2022-02-24 |
2022-03-10 |
2022-03-25 |
| 2021-11-23 |
4 |
$0.1 |
0.33% |
2021-11-10 |
2021-11-24 |
2021-12-09 |
| 2021-08-24 |
4 |
$0.1 |
0.32% |
2021-08-11 |
2021-08-25 |
2021-09-09 |
| 2021-05-25 |
4 |
$0.1 |
0.36% |
2021-05-12 |
2021-05-26 |
2021-06-10 |
| 2021-03-10 |
4 |
$0.07 |
0.34% |
2021-02-25 |
2021-03-11 |
2021-03-26 |
TransUnion's dividend yield falls in the middle range when compared to its industry peers, with Resources Connection (NASDAQ:RGP) having the highest annualized dividend yield at 3.98%.
Analyzing TransUnion Financial Health
Companies that pay out steady cash dividends are attractive to income-seeking investors, and companies that are financially healthy tend to maintain their dividend payout schedule. For this reason, investors can find it insightful to see if a company has been increasing or decreasing their dividend payout schedule and if their earnings are growing.
YoY Growth in Dividend Per Share
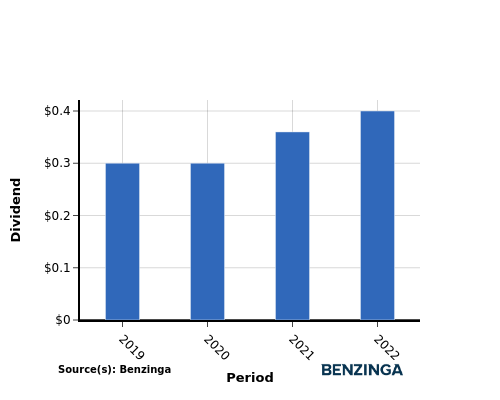
As you can see, from 2019 to 2022, investors saw an average increase in the company's dividend per share, rising from $0.30 in 2019 to $0.40 in 2022. This is good for investors because it shows that the company has steadily returned more capital back to their shareholders and it could mean that they are planning to continue increasing dividends.
YoY Earnings Growth For TransUnion
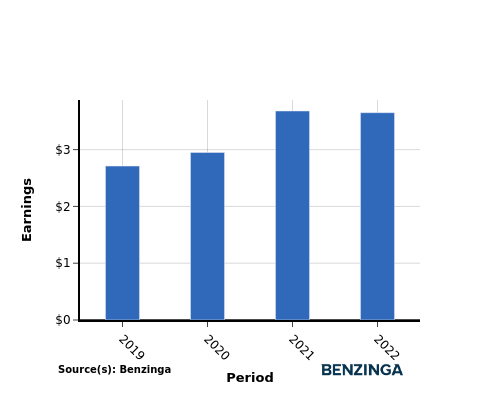
The earnings chart above shows that from 2019 to 2022, TransUnion has experienced an increase in their earnings from $2.71 per share to $3.65 per share. This positive earnings trend is promising for income-seeking investors as it suggests that the company has more potential to increase its cash dividend payout if the trend continues.
Recap
In this article, we explore the recent dividend payout of TransUnion and its significance for shareholders. The company has decided to distribute a dividend of $0.10 per share today, which equates to an annualized dividend yield of 0.88%.
TransUnion's dividend yield falls in the middle range when compared to its industry peers, with Resources Connection having the highest annualized dividend yield at 3.98%.
The upward trend in dividend per share and earnings per share for TransUnion from 2019 to 2022 reflects a strong financial position, supporting the company's ability to consistently distribute profits to their investors.
To stay well-informed about potential changes in financials or dividend disbursements, investors should closely observe the company's performance in the upcoming quarters.
\To stay up-to-date with the companies that are announcing their dividends, click here to visit our Dividends Calendar.
This article was generated by Benzinga's automated content engine and reviewed by an editor.
Posted In: RGP TRU


