MGIC Investment Delivers Strong Performance and Growing Profits, Elevating Investor Returns
Author: Benzinga Insights | November 28, 2023 11:05am
At the end of today, November 28, 2023, MGIC Investment (NYSE:MTG) will distribute a dividend payout of $0.12 per share, translating to an annualized dividend yield of 2.78%. Shareholders who held the stock before the ex-dividend date on November 08, 2023 will benefit from this payout.
MGIC Investment Recent Dividend Payouts
| Ex-Date |
Payments per year |
Dividend |
Yield |
Announced |
Record |
Payable |
| 2023-11-08 |
4 |
$0.12 |
2.78% |
2023-10-26 |
2023-11-09 |
2023-11-28 |
| 2023-08-09 |
4 |
$0.12 |
2.73% |
2023-07-27 |
2023-08-10 |
2023-08-24 |
| 2023-05-10 |
4 |
$0.1 |
2.84% |
2023-04-27 |
2023-05-11 |
2023-05-25 |
| 2023-02-16 |
4 |
$0.1 |
2.89% |
2023-01-24 |
2023-02-17 |
2023-03-02 |
| 2022-11-09 |
4 |
$0.1 |
3.06% |
2022-10-27 |
2022-11-10 |
2022-11-23 |
| 2022-08-10 |
4 |
$0.1 |
2.9% |
2022-07-28 |
2022-08-11 |
2022-08-25 |
| 2022-05-11 |
4 |
$0.08 |
2.47% |
2022-04-28 |
2022-05-12 |
2022-05-26 |
| 2022-02-15 |
4 |
$0.08 |
2.1% |
2022-01-25 |
2022-02-16 |
2022-03-02 |
| 2021-11-09 |
4 |
$0.08 |
2.0% |
2021-10-28 |
2021-11-11 |
2021-11-23 |
| 2021-08-11 |
4 |
$0.08 |
2.34% |
2021-07-29 |
2021-08-12 |
2021-08-26 |
| 2021-05-12 |
4 |
$0.06 |
1.55% |
2021-04-29 |
2021-05-13 |
2021-05-27 |
| 2021-02-16 |
4 |
$0.06 |
1.92% |
2021-01-26 |
2021-02-17 |
2021-03-03 |
MGIC Investment's dividend yield falls in the middle range when compared to its industry peers, with Greystone Housing Impact (NYSE:GHI) having the highest annualized dividend yield at 8.80%.
Analyzing MGIC Investment Financial Health
Companies that pay out steady cash dividends are attractive to income-seeking investors, and companies that are financially healthy tend to maintain their dividend payout schedule. For this reason, investors can find it insightful to see if a company has been increasing or decreasing their dividend payout schedule and if their earnings are growing.
YoY Growth in Dividend Per Share
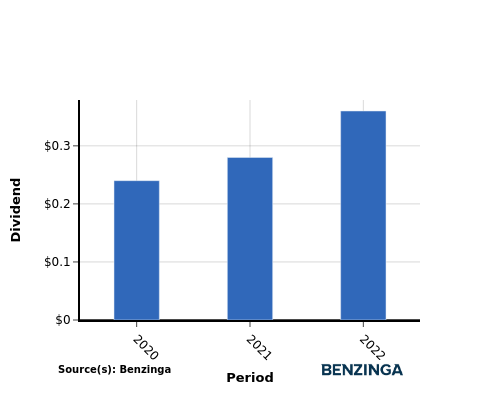
From 2020 to 2022, the company's dividend per share showed a positive trend, increasing steadily from $0.24 in 2020 to $0.36 in 2022. This demonstrates the company's commitment to rewarding shareholders by consistently raising dividends.
YoY Earnings Growth For MGIC Investment
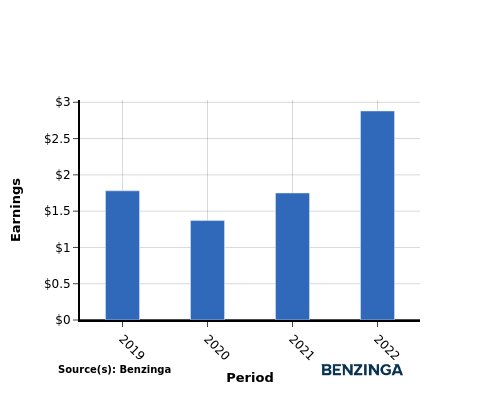
Investors can observe a growth in earnings for MGIC Investment from 2020 to 2022, as earnings per share increased from $1.78 to $2.88. This upward trajectory in earnings indicates potential for future cash dividend payout increases, which can be advantageous for income-seeking investors.
Recap
This article delves into the recent dividend payout of MGIC Investment and its implications for shareholders. Presently, the company is distributing a dividend of $0.12 per share, leading to an annualized dividend yield of 2.78%.
MGIC Investment's dividend yield falls in the middle range when compared to its industry peers, with Greystone Housing Impact having the highest annualized dividend yield at 8.80%.
Given that MGIC Investment has experienced an increase in dividend per share from 2020 to 2022 along with an increase in earnings per share, it could signal that the company is in good financial standing and that they could be positioned to continue distributing their profits back to their investors.
To stay well-informed about potential changes in financials or dividend disbursements, investors should closely observe the company's performance in the upcoming quarters.
\To read more news on MGIC Investment click here
Click here to visit our Dividends Calendar.
This article was generated by Benzinga's automated content engine and reviewed by an editor.
Posted In: GHI MTG


