P/E Ratio Insights for ING Groep
Author: Benzinga Insights | November 27, 2023 11:45am
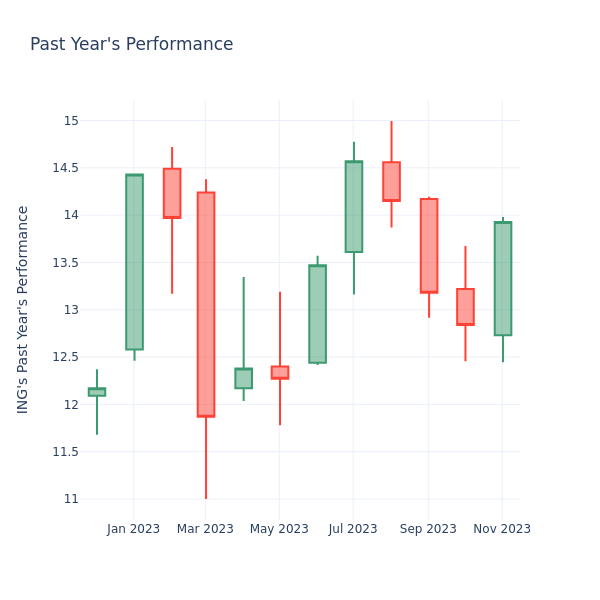
In the current market session, ING Groep Inc. (NYSE:ING) stock price is at $13.91, after a 0.22% decrease. However, over the past month, the company's stock increased by 8.48%, and in the past year, by 15.98%. Shareholders might be interested in knowing whether the stock is overvalued, even if the company is not performing up to par in the current session.
Evaluating ING Groep P/E in Comparison to Its Peers
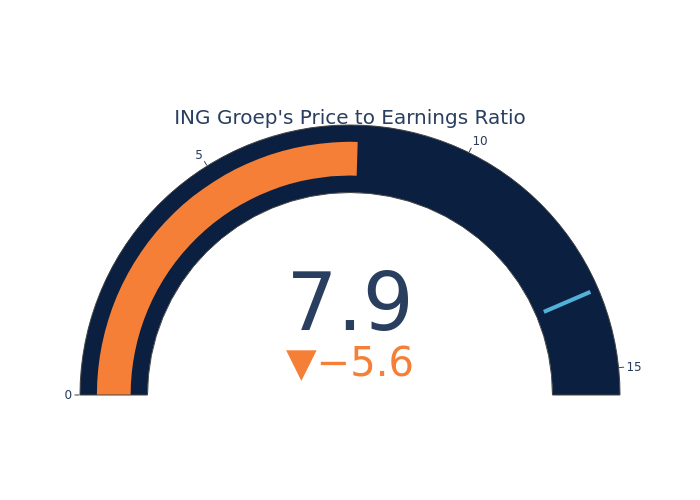
The P/E ratio is used by long-term shareholders to assess the company's market performance against aggregate market data, historical earnings, and the industry at large. A lower P/E could indicate that shareholders do not expect the stock to perform better in the future or it could mean that the company is undervalued.
ING Groep has a lower P/E than the aggregate P/E of 13.49 of the Banks industry. Ideally, one might believe that the stock might perform worse than its peers, but it's also probable that the stock is undervalued.
In conclusion, the price-to-earnings ratio is a useful metric for analyzing a company's market performance, but it has its limitations. While a lower P/E can indicate that a company is undervalued, it can also suggest that shareholders do not expect future growth. Additionally, the P/E ratio should not be used in isolation, as other factors such as industry trends and business cycles can also impact a company's stock price. Therefore, investors should use the P/E ratio in conjunction with other financial metrics and qualitative analysis to make informed investment decisions.
Posted In: ING