Sustaining Growth Momentum: CapStar Finl Hldgs Continues to Excel and Reports Rising Profits
Author: Benzinga Insights | November 22, 2023 11:05am
By the end of today, November 22, 2023, CapStar Finl Hldgs (NASDAQ:CSTR) is set to deliver a dividend payout of $0.11 per share, equating to an annualized dividend yield of 2.94%. The company's dividend payout went ex-dividend on November 07, 2023, so only the investors that owned the stock prior to the ex-dividend date will receive this payout.
CapStar Finl Hldgs Recent Dividend Payouts
| Ex-Date |
Payments per year |
Dividend |
Yield |
Announced |
Record |
Payable |
| 2023-11-07 |
4 |
$0.11 |
2.94% |
2023-10-26 |
2023-11-08 |
2023-11-22 |
| 2023-08-08 |
4 |
$0.11 |
3.3% |
2023-07-19 |
2023-08-09 |
2023-08-23 |
| 2023-05-09 |
4 |
$0.11 |
3.13% |
2023-04-19 |
2023-05-10 |
2023-05-24 |
| 2023-02-07 |
4 |
$0.1 |
2.2% |
2023-01-18 |
2023-02-08 |
2023-02-22 |
| 2022-11-08 |
4 |
$0.1 |
2.07% |
2022-10-19 |
2022-11-09 |
2022-11-23 |
| 2022-08-09 |
4 |
$0.1 |
1.96% |
2022-07-20 |
2022-08-10 |
2022-08-24 |
| 2022-05-10 |
4 |
$0.1 |
1.9% |
2022-04-21 |
2022-05-11 |
2022-05-25 |
| 2022-02-08 |
4 |
$0.06 |
1.12% |
2022-01-27 |
2022-02-09 |
2022-02-23 |
| 2021-11-09 |
4 |
$0.06 |
1.1% |
2021-10-21 |
2021-11-10 |
2021-11-24 |
| 2021-08-10 |
4 |
$0.06 |
1.15% |
2021-07-22 |
2021-08-11 |
2021-08-25 |
| 2021-05-11 |
4 |
$0.06 |
1.35% |
2021-04-22 |
2021-05-12 |
2021-05-26 |
| 2021-02-09 |
4 |
$0.05 |
1.44% |
2021-01-28 |
2021-02-10 |
2021-02-24 |
When comparing CapStar Finl Hldgs's dividend yield against its industry peers, the company sits comfortably in the middle, with its peer West Bancorp (NASDAQ:WTBA) having the highest annualized dividend yield at 5.67%.
Analyzing CapStar Finl Hldgs Financial Health
Companies that pay out steady cash dividends are attractive to income-seeking investors, and companies that are financially healthy tend to maintain their dividend payout schedule. For this reason, investors can find it insightful to see if a company has been increasing or decreasing their dividend payout schedule and if their earnings are growing.
YoY Growth in Dividend Per Share
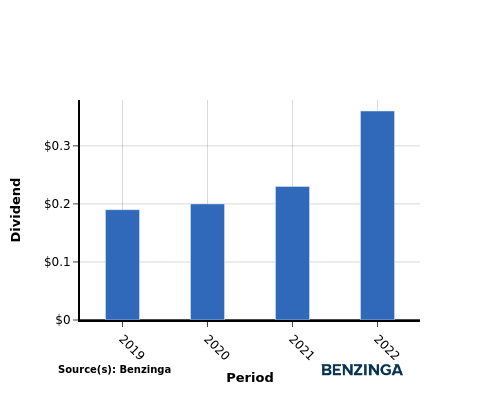
From 2019 to 2022, the company's dividend per share showed a positive trend, increasing steadily from $0.19 in 2019 to $0.36 in 2022. This demonstrates the company's commitment to rewarding shareholders by consistently raising dividends.
YoY Earnings Growth For CapStar Finl Hldgs
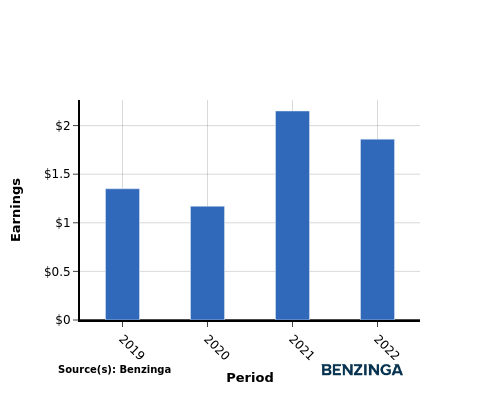
From 2019 to 2022, CapStar Finl Hldgs has demonstrated an upward trend in earnings, with earnings per share rising from $1.35 to $1.86. This positive earnings growth bodes well for investors looking to generate income through cash dividend payouts.
Recap
This article takes an in-depth look at CapStar Finl Hldgs's recent dividend payout and its implications for shareholders. The company is currently distributing a dividend of $0.11 per share today, translating to an annualized dividend yield of 2.94%.
When comparing CapStar Finl Hldgs's dividend yield against its industry peers, the company sits comfortably in the middle, with its peer West Bancorp having the highest annualized dividend yield at 5.67%.
With an increase in dividend per share and earnings per share from 2019 to 2022, CapStar Finl Hldgs demonstrates a healthy financial status and is likely to maintain their dividend distribution to investors.
It is essential for investors to closely track the company's performance in the coming quarters to remain updated regarding any alterations in financials or dividend disbursements.
\To read more news on CapStar Finl Hldgs click here
Click here to visit our Dividends Calendar.
This article was generated by Benzinga's automated content engine and reviewed by an editor.
Posted In: CSTR WTBA


