Viridian Chart Of The Week: A Valuable Investor Tool To Track Cannabis Credit Quality
Author: Viridian Capital Advisors | October 16, 2023 12:23pm
Monitoring the credit quality of portfolio companies has become critical in the capital-starved environment of 2023, and, in fact, credit analysis has become the new equity analysis. Credit quality is multidimensional by nature: The Viridian Credit Tracker Model uses 11 market and financial variables to quantify four main credit factors: Liquidity, Leverage, Profitability, and Size, each of which we believe contributes to a full understanding of a company’s overall credit quality.
It is sometimes advantageous, however, to have a single indicator of credit quality to use as a portfolio monitoring tool. We believe the best single number that an investor can calculate is Total Liabilities/ Market Cap. Variations of this ratio have a rich history in credit distress prediction. It is one of the ratios in the widely used Z-score model first developed by Ed Altman at NYU in 1968, and it was a cornerstone of Drexel Burnham's analysis of junk bond credits in the 1980s. It is the most highly weighted leverage indicator in the Viridian Credit Tracker model.
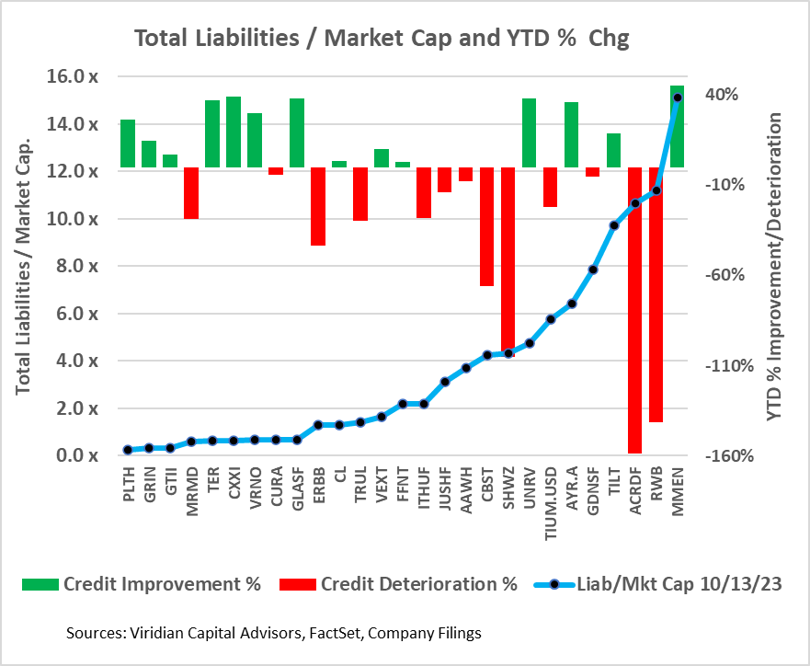
The blue line on the graph shows Total Liabilities/Market Cap as of 10/13/23. The bars show either improvement or deterioration indicated by the ratio; we have reversed the signs so that reduction in the ratio shows as a positive, green bar, while deterioration (increases) shows as a negative red bar. C21 (OTC:CXXIF), Unrivaled (OTC:UNRV), Glass House (OTC:GLASF), TerrAscend (OTC:TSNDF), and AYR (OTC:AYRWF) all show moderate improvement while MariMed (OTC:MRMD), Trulieve (OTC:TRUL), and Cannabist (OTC:CBSTF), show moderate deterioration. Schwazze, Red White & Bloom (OTC:RWBYF), and Acreage (OTC:ACRDF) all show more significant deterioration.
Total Liabilities / Market Cap has several advantages over more commonly used credit ratios like Debt/EBITDA or EBITDA/interest:
-
It’s dynamic, fluctuating every day rather than only when new quarterly data is released. News that impacts the stock will directly impact this ratio.
-
It immediately incorporates the market’s view of how “in the money” the company’s equity is, which measures based on financial statement data alone cannot capture.
-
Total Liabilities takes into account lease liabilities, taxes, and deferred acquisition liabilities, all critical in the cannabis sector.
-
It is easy to calculate and interpret while significantly outperforming traditional financial statement measures in distress prediction.
Downsides to the ratio include:
-
It neither directly measures liquidity nor accounts for size. We do not, for example, believe that American Green (OTC:ERBB) is a better credit than Cresco Labs (NYSE:CL). All of ERBB’s debt is classified as current, and the company’s financials contain going concern qualifications. The Viridian Credit model more appropriately ranks the company as #25 of the 27 companies in the graph.
Using the Total Liabilities/Market Cap ratio:
-
We recommend that investors create a spreadsheet to automatically download and calculate the ratio on a weekly basis.
-
Investors should intensify their review process for all credit scoring higher than 4x and consider “special mention” credits for anything over 6x.
-
Monitor the weekly changes and pay particular attention to consistency of direction. On any given week, overall market movements will move the ratio. But consistent movement in either direction, especially when this movement is against the market, should be investigated.
-
No one statistic can replace careful quantitative and qualitative analysis and modeling, but Total Liabilities/Market Cap belongs in every debt and equity investor’s toolkit and monitoring system.
The Viridian Capital Chart of the Week highlights key investment, valuation and M&A trends taken from the Viridian Cannabis Deal Tracker.
The Viridian Cannabis Deal Tracker provides the market intelligence that cannabis companies, investors, and acquirers utilize to make informed decisions regarding capital allocation and M&A strategy. The Deal Tracker is a proprietary information service that monitors capital raise and M&A activity in the legal cannabis, CBD, and psychedelics industries. Each week the Tracker aggregates and analyzes all closed deals and segments each according to key metrics:
-
Deals by Industry Sector (To track the flow of capital and M&A Deals by one of 12 Sectors - from Cultivation to Brands to Software)
-
Deal Structure (Equity/Debt for Capital Raises, Cash/Stock/Earnout for M&A) Status of the company announcing the transaction (Public vs. Private)
-
Principals to the Transaction (Issuer/Investor/Lender/Acquirer) Key deal terms (Pricing and Valuation)
-
Key Deal Terms (Deal Size, Valuation, Pricing, Warrants, Cost of Capital)
-
Deals by Location of Issuer/Buyer/Seller (To Track the Flow of Capital and M&A Deals by State and Country)
-
Credit Ratings (Leverage and Liquidity Ratios)
Since its inception in 2015, the Viridian Cannabis Deal Tracker has tracked and analyzed more than 2,500 capital raises and 1,000 M&A transactions totaling over $50 billion in aggregate value.
The preceding article is from one of our external contributors. It does not represent the opinion of Benzinga and has not been edited.
Posted In: ACRDF AYRWF CBSTF CL CXXIF ERBB GLASF MRMD RWBYF TRUL TSNDF UNRV