Sustaining Growth Momentum: Barings BDC Continues to Excel and Reports Rising Profits
Author: Benzinga Insights | September 13, 2023 11:05am
At the end of today, September 13, 2023, Barings BDC (NYSE:BBDC) will distribute a dividend payout of $0.26 per share, translating to an annualized dividend yield of 12.28%. Shareholders who held the stock before the ex-dividend date on September 05, 2023 will benefit from this payout.
Barings BDC Recent Dividend Payouts
| Ex-Date |
Payments per year |
Dividend |
Yield |
Announced |
Record |
Payable |
| 2023-09-05 |
4 |
$0.26 |
12.28% |
2023-08-09 |
2023-09-06 |
2023-09-13 |
| 2023-06-06 |
4 |
$0.25 |
13.46% |
2023-05-04 |
2023-06-07 |
2023-06-14 |
| 2023-03-07 |
4 |
$0.25 |
11.61% |
2023-02-23 |
2023-03-08 |
2023-03-15 |
| 2022-12-06 |
4 |
$0.24 |
10.79% |
2022-11-10 |
2022-12-07 |
2022-12-14 |
| 2022-09-06 |
4 |
$0.24 |
9.48% |
2022-08-09 |
2022-09-07 |
2022-09-14 |
| 2022-06-07 |
4 |
$0.24 |
9.34% |
2022-05-05 |
2022-06-08 |
2022-06-15 |
| 2022-02-15 |
4 |
$0.23 |
8.49% |
2022-02-01 |
2022-02-16 |
2022-02-23 |
| 2021-11-23 |
4 |
$0.22 |
7.73% |
2021-11-09 |
2021-11-24 |
2021-12-01 |
| 2021-09-07 |
4 |
$0.21 |
7.88% |
2021-08-05 |
2021-09-08 |
2021-09-15 |
| 2021-06-08 |
4 |
$0.2 |
7.72% |
2021-05-06 |
2021-06-09 |
2021-06-16 |
| 2021-03-09 |
4 |
$0.19 |
8.28% |
2021-02-09 |
2021-03-10 |
2021-03-17 |
| 2020-11-24 |
4 |
$0.17 |
8.63% |
2020-11-09 |
2020-11-25 |
2020-12-02 |
With a dividend yield that places it neither at the top nor the bottom, Barings BDC finds itself in the middle among its industry peers, while Trinity Cap (NASDAQ:TRIN) boasts the highest annualized dividend yield at 14.46%.
Analyzing Barings BDC Financial Health
Companies that pay out steady cash dividends are attractive to income-seeking investors, and companies that are financially healthy tend to maintain their dividend payout schedule. For this reason, investors can find it insightful to see if a company has been increasing or decreasing their dividend payout schedule and if their earnings are growing.
YoY Growth in Dividend Per Share
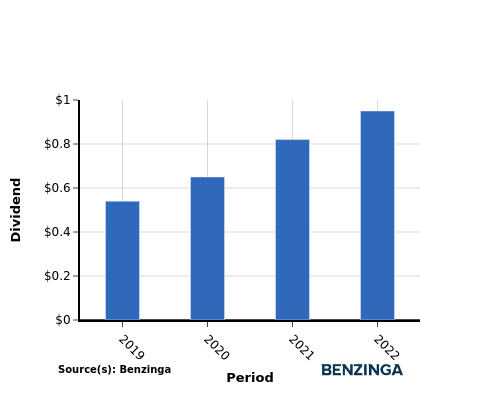
The company demonstrated a positive dividend growth pattern from 2019 to 2022, with the dividend per share rising from $0.54 to $0.95. This signifies the company's commitment to consistently increasing shareholder dividends.
YoY Earnings Growth For Barings BDC
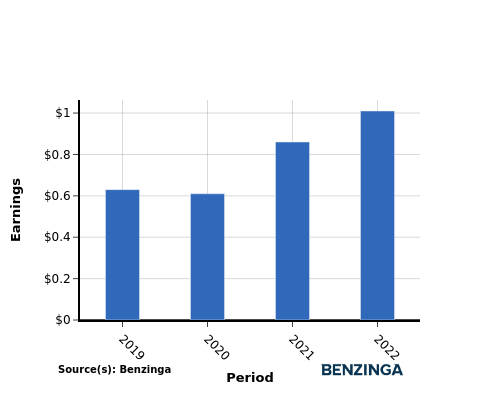
Investors can observe a growth in earnings for Barings BDC from 2019 to 2022, as earnings per share increased from $0.63 to $1.01. This upward trajectory in earnings indicates potential for future cash dividend payout increases, which can be advantageous for income-seeking investors.
Recap
In this article, we explore the recent dividend payout of Barings BDC and its significance for shareholders. The company has decided to distribute a dividend of $0.26 per share today, which equates to an annualized dividend yield of 12.28%.
With a dividend yield that places it neither at the top nor the bottom, Barings BDC finds itself in the middle among its industry peers, while Trinity Cap boasts the highest annualized dividend yield at 14.46%.
Given that Barings BDC has experienced an increase in dividend per share from 2019 to 2022 along with an increase in earnings per share, it could signal that the company is in good financial standing and that they could be positioned to continue distributing their profits back to their investors.
Investors are advised to closely monitor the company's performance in the upcoming quarters to stay informed about any fluctuations in financials or dividend disbursements.
[See current stock movements Barings BDC on Benzinga.](https://www.benzinga.com/quote/Barings BDC (NYSE: BBDC))
This article was generated by Benzinga's automated content engine and reviewed by an editor.
Posted In: BBDC TRIN


