Economic Pivot: GDP Downward Revision Sparks Market Upswing, Reshapes Sentiment
Author: Melanie Schaffer | August 30, 2023 01:12pm
The SPDR S&P 500 (NYSE:SPY) was rising over 0.5% higher Wednesday after the Bureau of Economic Analysis downwardly revised U.S. GDP to 2.1% in the second quarter, reflecting softer economic growth.
The revision indicates the Federal Reserve’s monetary tightening policy is working, which brought investors hope the central bank may hold interest rates steady when it meets next month.
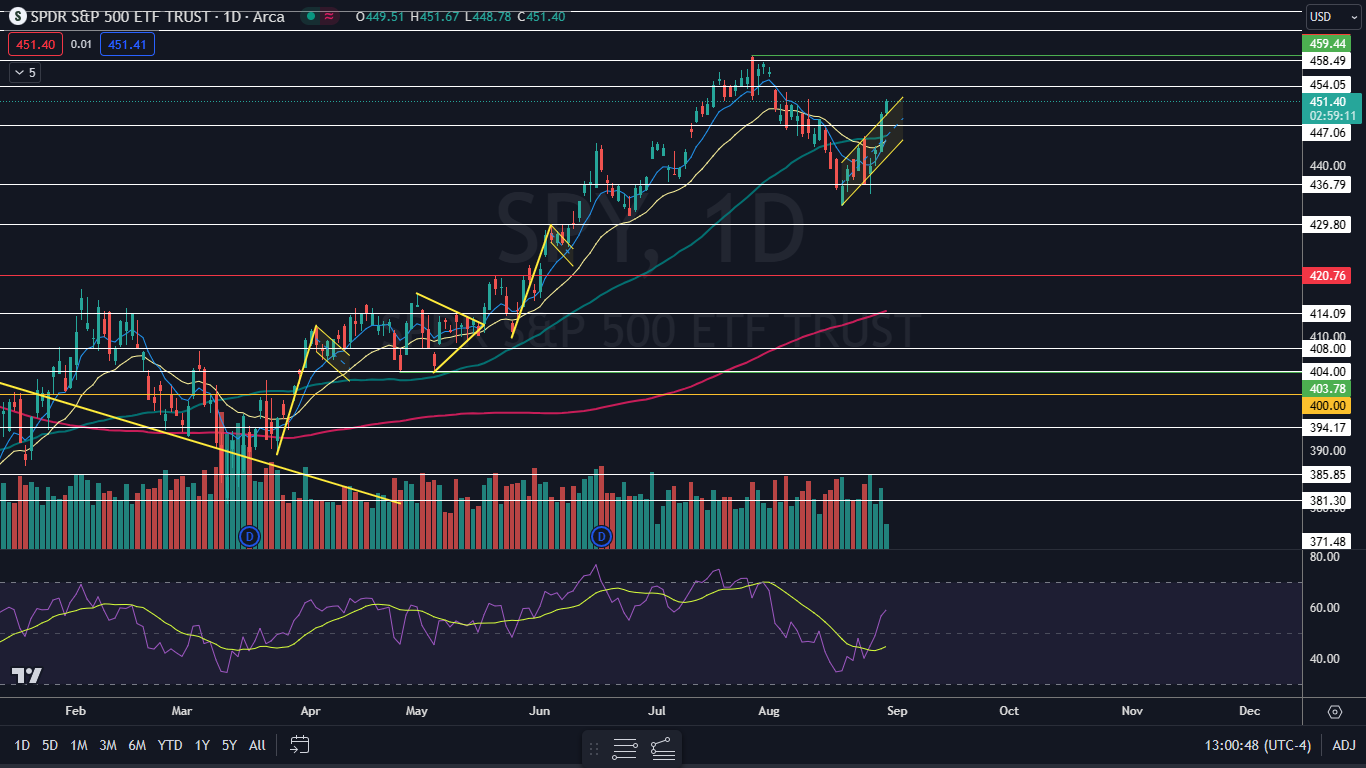
The SPY’s move higher caused the market ETF to break up from a rising channel pattern, which often happens in bull cycles. The SPY hasn’t formed a higher low since Aug. 25, however, which indicates a retracement is likely on the horizon.
When the SPY retraces to form at least another higher low, volatility in the stock market is likely to tick higher.
Traders wishing to trade the potential volatility have multiple options, including the ConvexityShares Daily 1.5x SPIKES Futures ETF (NYSE:SPKY).
SPKY is a 1.5x leveraged fund, which tracks the SPIKES Futures Short-Term Index and measures volatility in broad-based equities in a similar way to ProShares Ultra VIX Short Term Futures ETF (NYSE:UVXY), which tracks the movement of the S&P 500 VIX Short-Term Futures Index.
For every 1% daily movement in the SPIKES Futures Short-Term Index, the SPKY fund seeks to move 1.5%, meaning that it’s for short-term trades and should not be held for a long period of time.
Want direct analysis? Find me in the BZ Pro lounge! Click here for a free trial.
The SPY Chart: The SPY formed a bullish Marubozu candlestick on Tuesday, which indicates higher prices were likely to come on Wednesday. On Wednesday, the SPY was attempting to form a second bullish Marubozu candlestick, which suggests higher prices could come again on Thursday.
- If the ETF closes Wednesday’s session with an upper wick, however, a shooting star candlestick will form, which could indicate the local top has occurred and a retracement will take place. If that happens, bullish traders want to see the stock hold above the upper ascending trend line of the channel.
- Bearish traders want to see big bearish volume come in and drop the SPY back into the channel, and then for continuation to push the ETF down toward the bottom trend line of the formation. If the SPY were to eventually break down under the channel, a longer-term downtrend could be in the cards.
- The SPY has resistance above at $454.05 and at $458.49 and support below at $447.06 and at $436.79.
 Read Next: Spot Gold Rises As Cracks In The U.S. Economy Start To Show: This Double-Leveraged Fund Can Accelerate Gains -
Image sourced from Shutterstock
Posted In: SPKY SPY UVXY