The Stock Market Surges Higher Fueled By Decrease In U.S. Job Openings: A Look At The SPY
Author: Melanie Schaffer | August 29, 2023 02:03pm
The SPDR S&P 500 (NYSE:SPY) was surging over 1% higher Tuesday after data released for July showed U.S. job openings decreased below 9 million for the first time since March 2021.
The data indicates that the stubbornly strong labor market has started to cool, giving investors hope that the Federal Reserve’s rate hike campaign is finally succeeding, which could convince the central bank to apply a pause next month.
The SPY’s move higher confirmed the market ETF is trading in an uptrend, with the formation of a higher high. An uptrend occurs when a stock consistently makes a series of higher highs and higher lows on the chart.
The higher highs indicate the bulls are in control while the intermittent higher lows indicate consolidation periods.
Traders can use moving averages to help identify an uptrend, with rising lower time frame moving averages (such as the eight-day or 21-day exponential moving averages) indicating the stock is in a steep shorter-term uptrend.
Rising longer-term moving averages (such as the 200-day simple moving average) indicate a long-term uptrend.
Although the SPY isn’t showing signs that the local top has occurred, eventually the ETF will retrace to form at least another higher low. When that happens, volatility is likely to increase. Traders wishing to trade the potential volatility have multiple options, including the ConvexityShares Daily 1.5x SPIKES Futures ETF (NYSE:SPKY).
SPKY is a 1.5x leveraged fund, which tracks the SPIKES Futures Short-Term Index and measures volatility in broad-based equities in a similar way to ProShares Ultra VIX Short Term Futures ETF (NYSE:UVXY), which tracks the movement of the S&P 500 VIX Short-Term Futures Index.
For every 1% daily movement in the SPIKES Futures Short-Term Index, the SPKY fund seeks to move 1.5%, meaning that it’s for short-term trades and should not be held for a long period of time.
Want direct analysis? Find me in the BZ Pro lounge! Click here for a free trial.
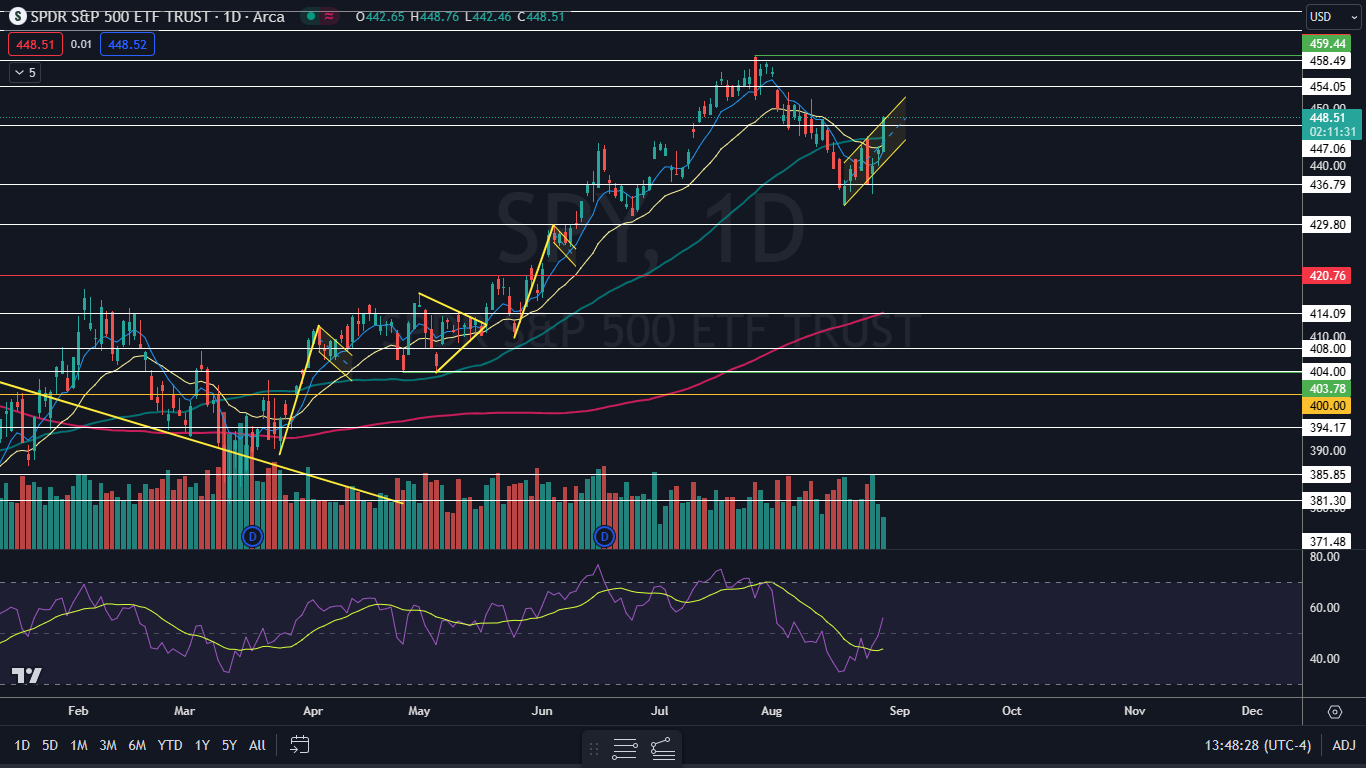
The SPY Chart: The SPY began trading in an uptrend on Aug. 18, which was confirmed when the ETF retraced to form a higher low at the $435 mark on Aug. 25. On Tuesday, the SPY rose above the most recent high but was't showing any indication a retracement is in the cards for Wednesday.
- If the SPY closes Tuesday’s trading session near its high-of-day, the ETF will print a bullish Marubozu candlestick, which could indicate higher prices will come again on Wednesday. The second most likely scenario is that the ETF prints an inside bar pattern, which would indicate consolidation is needed.
- Bullish traders want to see the SPY close above the 50-day simple moving average and hold above the area when the ETF eventually retraces. Bearish traders want to see big bearish volume come in and break the SPY down to form a lower low, which would negate the uptrend and indicate a downtrend could be on the horizon.
- The SPY has resistance above at $454.05 and at $458.49 and support below at $447.06 and at $436.79.
 Read Next: Why The S&P 500 Could Break New Ground By October While Other Sectors Stumble
Posted In: SPKY SPY UVXY