Apple Stock Shows Indecision With More Rate Hikes Left On The Table: The Bull, Bear Case
Author: Melanie Schaffer | August 25, 2023 12:05pm
Apple, Inc (NASDAQ:AAPL) broke briefly under Thursday’s low-of-day on Friday, after Federal Reserve chair Jerome Powell spoke at the Jackson Hole Symposium and indicated the central bank hasn’t taken more interest rates off the table.
The trading action had Apple looking to print a doji candlestick, which could indicate a higher low has formed. If the candlestick is recognized, and Apple trades higher on Monday, a new uptrend may be on the horizon.
An uptrend occurs when a stock consistently makes a series of higher highs and higher lows on the chart.
The higher highs indicate the bulls are in control while the intermittent higher lows indicate consolidation periods.
Traders can use moving averages to help identify an uptrend, with rising lower time frame moving averages (such as the eight-day or 21-day exponential moving averages) indicating the stock is in a steep shorter-term uptrend.
Rising longer-term moving averages (such as the 200-day simple moving average) indicate a long-term uptrend.
If Apple falls lower on Monday, however, the higher high formed on Wednesday, which negated the downtrend, could serve as a bull trap and the trend lower could continue. If that happens, volatility in the stock market could increase due to how heavily weighted Apple is within the S&P 500.
Traders wishing to trade the potential volatility have multiple options, including the ConvexityShares Daily 1.5x SPIKES Futures ETF (NYSE:SPKY).
SPKY is a 1.5x leveraged fund, which tracks the SPIKES Futures Short-Term Index and measures volatility in broad-based equities in a similar way to ProShares Ultra VIX Short Term Futures ETF (NYSE:UVXY), which tracks the movement of the S&P 500 VIX Short-Term Futures Index.
For every 1% daily movement in the SPIKES Futures Short-Term Index, the SPKY fund seeks to move 1.5%, meaning that it’s for short-term trades and should not be held for a long period of time.
Want direct analysis? Find me in the BZ Pro lounge! Click here for a free trial.
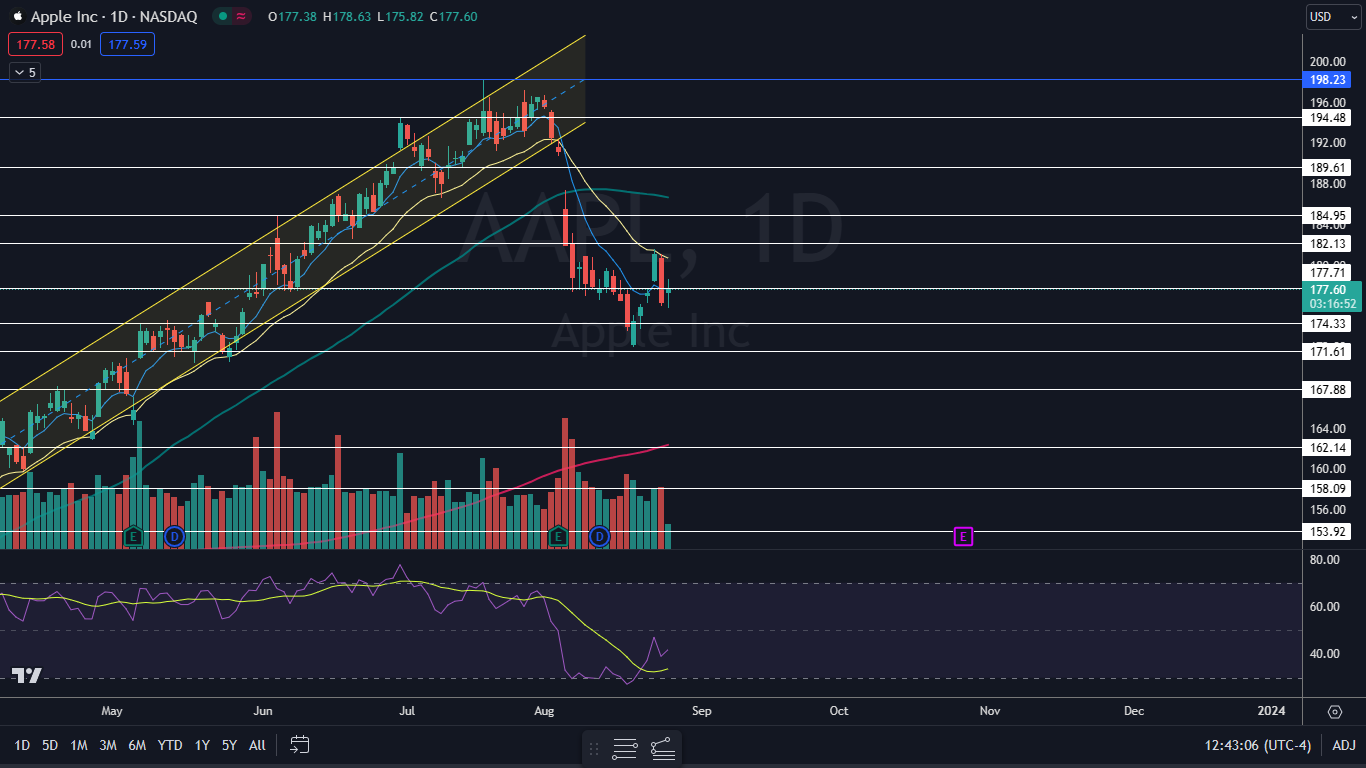
The Apple Chart: On Wednesday, Apple formed a higher high at the $181.55 mark, which came in above the most recent lower high, which was printed at the $179.69 mark on Aug. 14. The higher high negated the downtrend but a higher low, above $171.96 hasn’t yet formed to confirm a new uptrend.
- On Friday, Apple was trading mostly sideways on low volume, which indicates the stock is in a consolidation phase. If Apple continues to trade sideways on Monday, traders can watch for a series of possible inside bars to develop on decreasing volume before the stock chooses a direction.
- Bullish traders want to see big bullish volume come in and break Apple up above the 21-day exponential moving average (EMA), which would give bullish traders more confidence going forward. Bearish traders want to see the stock close under the eight-day EMA, which could accelerate a move to the downside.
- Apple has resistance above at $177.71 and at $182.13 and support below at $174.33 and at $171.61.
 Read Next: The SPY Swings Wildly Following Hawkish Comments At Jackson Hole Symposium: This ETF Tracks Stock Market Volatility
Image sourced from Shutterstock
Posted In: AAPL SPKY UVXY