The SPY Swings Wildly Following Hawkish Comments At Jackson Hole Symposium: This ETF Tracks Stock Market Volatility
Author: Melanie Schaffer | August 25, 2023 12:29pm
The SPDR S&P 500 (NYSE:SPY) was volatile Friday after Federal Reserve chair Jerome Powell’s opening remarks at the Jackson Hole Symposium indicated the central bank may continue to raise interest rates and hold them at a restrictive level until inflation falls to its 2% goal.
The volatile price action follows a bearish day on Thursday, which saw the market ETF drop about 1.4% on high volume, falling through a potential bear flag pattern on the daily chart.
The move caused volatility in the stock market to increase, with the ConvexityShares Daily 1.5x SPIKES Futures ETF (NYSE:SPKY) spiking up almost 9% from its low-of-day.
SPKY is a 1.5x leveraged fund, which tracks the SPIKES Futures Short-Term Index and measures volatility in broad-based equities in a similar way to ProShares Ultra VIX Short Term Futures ETF (NYSE:UVXY), which tracks the movement of the S&P 500 VIX Short-Term Futures Index.
For every 1% daily movement in the SPIKES Futures Short-Term Index, the SPKY fund seeks to move 1.5%, meaning that it’s for short-term trades and should not be held for a long period of time.
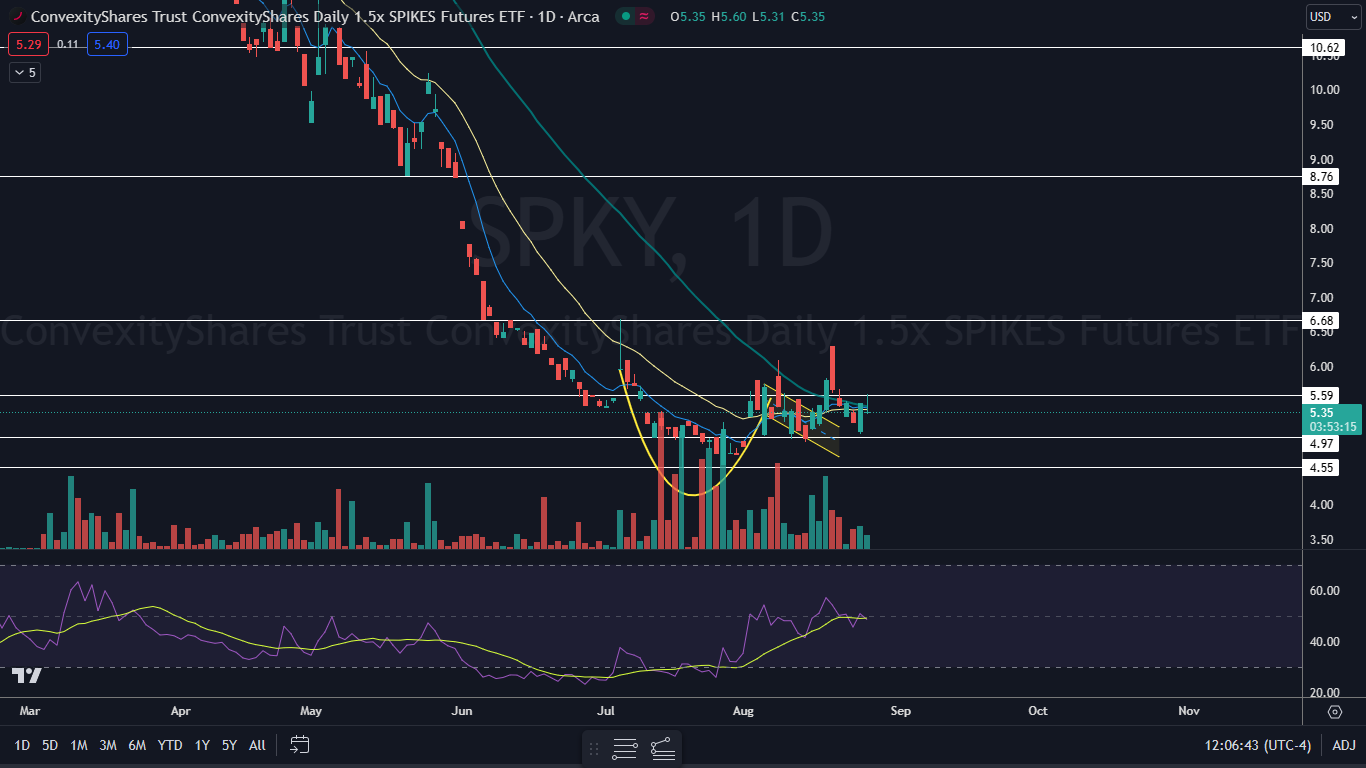
On Friday, SPKY was trading slightly higher at one point, attempting to break up through a resistance level near the $5.60 mark but on low volume, which indicates consolidation.
Want direct analysis? Find me in the BZ Pro lounge! Click here for a free trial.
The SPKY Chart: Although SPKY negated its downtrend on Thursday by forming a higher low above $4.91, the price action on Friday may serve as a lower high, which may give investors pause. After the big bullish move in the ETF on Thursday, sideways consolidation may be needed prior to the ETF either confirming a new uptrend or continuing in a downtrend.
- Momentum in SPKY has been increasing, with its relative strength index (RSI) forming a series of higher lows. The rising momentum indicates traders have an increased interest in the ETF.
- When SPKY surged higher on Thursday and popped slightly higher again on Friday, the ETF rejected the 50-day simple moving average as resistance and fell back under the area. If the ETF can regain the 50-day SMA over the next few trading days, it will give traders bullish on volatility more confidence going forward.
- SPKY has resistance above at $5.59 and at $6.68 and support below at $4.97 and at $4.55.
 Read Next: 'Magnificent 7' Tech Bubble To Burst With 'Higher-For-Longer' Rates, Top Wall Street Analyst Warns
Image sourced from Shutterstock
Posted In: SPKY SPY UVXY