The SPY Drops As Traders Price In A Hawkish Tone From Powell Friday Amid Strong Jobs Data: A Technical Analysis
Author: Melanie Schaffer | August 24, 2023 12:28pm
The SPDR S&P 500 (NYSE:SPY) opened slightly higher Thursday before running into a group of sellers who knocked the market ETF down from the top of a flag formation, which Benzinga called out on Wednesday.
The pop higher followed by the selling pressure came after Nvidia Corporation printed a second-quarter earnings beat, which caused the stock to surge higher in the aftermarket on Wednesday and the premarket on Thursday before dropping from its opening price.
The stock market may be anticipating a hawkish tone from Federal Reserve chair Jerome Powell, when he speaks at the Jackson Hole Symposium on Friday. Traders and investors will be listening carefully for clues as to whether the central bank will continue to hike interest rates into the end of 2023 or apply a pause.
Fear that the rate hike campaign may continue hit Thursday morning, when unemployment claims came in lower-than-expected. The data, released by the U.S. Labor Department, indicates the job market remains strong despite surging interest rates.
As for the stock market, the SPY remains trading in a possible bear flag pattern and if the formation is recognized and the ETF drops significantly on above-average-volume, volatility is the stock market is likely to increase.
Traders wishing to trade the potential volatility have multiple options, including the ConvexityShares Daily 1x SPIKES Futures ETF (NYSE:SPKX).
SPKX is a fund that tracks the SPIKES Futures Short-Term Index and measures volatility in broad-based equities in a similar way to ProShares Ultra VIX Short Term Futures ETF (NYSE:UVXY), which tracks the movement of the S&P 500 VIX Short-Term Futures Index.
Want direct analysis? Find me in the BZ Pro lounge! Click here for a free trial.
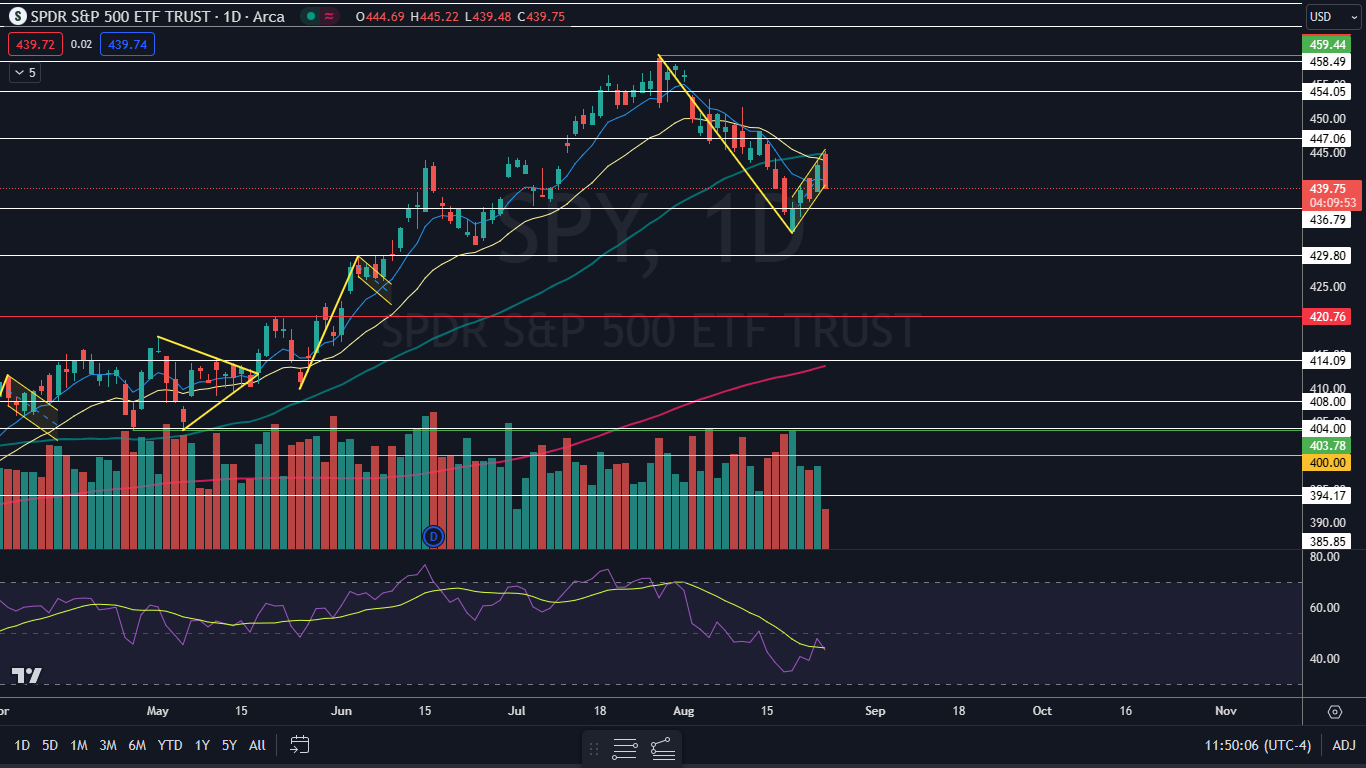
The SPY Chart: Although the SPY has popped higher at one point each day this week, the ETF hasn’t risen enough to negate its downtrend, which began on July 27. The most recent lower low within the trend was formed on Aug. 18 at $433.01 and the most recent confirmed lower high was printed at the $448.11 mark on Aug. 14.
- The downtrend, combined with the recent rebound has settled the SPY into a possible bear flag pattern on the daily chart. If the pattern is recognized, the measured move is about 5.75%, which suggests the SPY could retrace toward $419. If that happens, it will constitute a full market correction with the SPY dropping over 10% from its high.
- Bullish traders want to see the SPY continue trending upwards and eventually regain the eight-day exponential moving average as support, which would negate the bear flag. Bears want to see big bearish volume drop the SPY down from the flag formation and then for the ETF to form a lower low to confirm the downtrend remains intact.
- The SPY has resistance above at $447.06 and at $454.05 and support below at $436.79 and at $429.80.
 Read Next: BRICS Alliance Explores Expansion Amid Shifting World Order: Investors Eye These 5 ETFs
The SPY Drops As Traders Price In A Hawkish Tone From Powell Friday Amid Strong Jobs Data: A Technical Analysis
Posted In: SPKX SPY UVXY