The SPY Climbs Higher Ahead Of Jackson Hole Symposium: The Bull, Bear Case For The Stock Market
Author: Melanie Schaffer | August 23, 2023 01:48pm
The SPDR S&P 500 (NYSE:SPY) was rising about 1% during Wednesday’s trading session, ahead of Nvidia Corporation’s earnings print after the close and the Jackson Hole Symposium, scheduled for Friday.
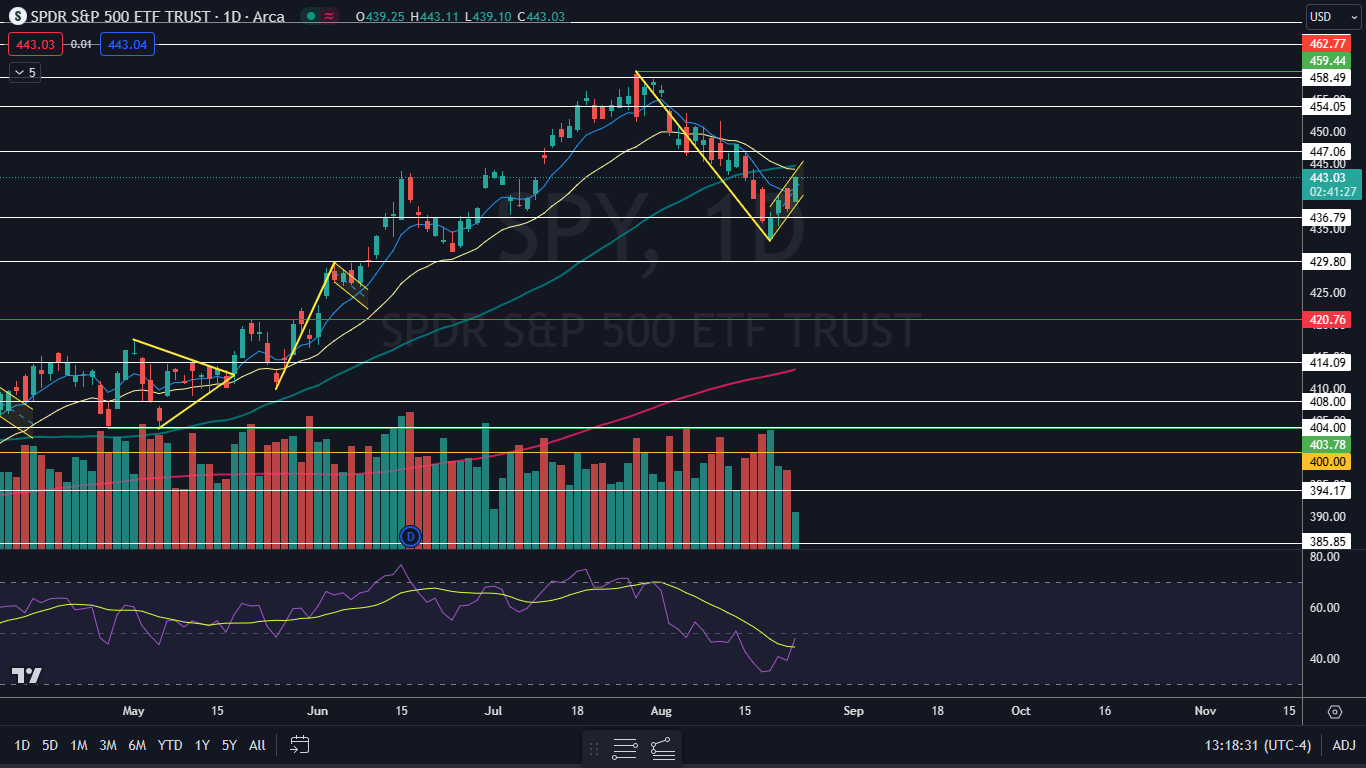
Between July 17 and Aug. 18, the SPY retraced significantly, falling 5.75% before beginning to rebound over the last four trading days. While the recent move higher has been welcomed by bullish traders, there’s a possibility the market ETF could be settling into a bear flag pattern.
The bear flag pattern is created with a steep drop lower forming the pole, which is then followed by a consolidation pattern that brings the stock higher between a channel with parallel lines or into a tightening triangle pattern.
If the SPY breaks down from the bear flag pattern, volatility in the stock market is likely to increase. Traders wishing to trade the potential volatility have multiple options, including the ConvexityShares Daily 1.5x SPIKES Futures ETF (NYSE:SPKY).
SPKY is a 1.5x leveraged fund, which tracks the SPIKES Futures Short-Term Index and measures volatility in broad-based equities in a similar way to ProShares Ultra VIX Short Term Futures ETF (NYSE:UVXY), which tracks the movement of the S&P 500 VIX Short-Term Futures Index.
For every 1% daily movement in the SPIKES Futures Short-Term Index, the SPKY fund seeks to move 1.5%, meaning that it’s for short-term trades and should not be held for a long period of time.
Want direct analysis? Find me in the BZ Pro lounge! Click here for a free trial.
The SPY Chart: For bullish traders, the "trend is your friend" (until it's not) and the SPY may continue to rise upwards within the channel for a period of time. Aggressive traders may decide to purchase the stock at the lower trendline and exit the trade at the higher trendline.
- If the SPY continues to trend higher and regains support at the 50-day simple moving average (SMA), the bear flag will be negated. The SPY may need to consolidate under or above the 50-day SMA, which could cause a higher low to develop, which would confirm a new uptrend.
- Bearish traders will want to watch for a breakdown from the lower descending trendline of the flag formation, on high volume. If the SPY breaks down from a bear flag pattern, the measured move lower could take the ETF toward the $417 mark.
- The SPY has resistance above at $447.06 and at $454.05 and support below at $436.79 and at $429.80.
 Read Next: What's Going On With Nvidia Stock Wednesday?
Image sourced from Shutterstock
Posted In: SPKY SPY UVXY