Stock Market Continues Slide To End Brutal Week Amid Housing Crisis Woes: The Bull, Bear Case
Author: Melanie Schaffer | August 18, 2023 01:01pm
The SPDR S&P 500 (NYSE:SPY) was trading about 0.3% lower Friday, popping up briefly from the low-of-day which saw the market ETF open the session down 0.67% amid concerns of a global housing crisis.
Fear that the Federal Reserve will continue to hike interest rates into the end of 2023 has made the situation worse, causing the SPY to decline almost 2% since Wednesday, when the Fed released its July monthly meeting minutes.
Since July 27, when the SPY reached its highest price since March 30, 2022, the ETF has slid over 5% lower –about half of what would be considered a full market correction. If the SPY drops the full 10%, it may find support and rebound from the 200-day simple moving average (SMA), which the ETF regained after a long-term bear cycle on March 24 of this year.
The 200-day SMA is an important bellwether. Technical traders and investors consider a stock trading above the level on the daily chart to be in a bull cycle, whereas a stock trading under the 200-day SMA is considered to be in a bear cycle.
The 50-day SMA also plays an important role in technical analysis, especially when paired with the 200-day. When the 50-day SMA crosses below the 200-day SMA, a death cross occurs whereas when the 50-day SMA crosses above the 200-day, a bullish golden cross takes place.
If the SPY continues within its steep downtrend, volatility, which was spiking higher on Friday, may continue to increase. Traders wishing to trade the potential volatility have multiple options, including the ConvexityShares Daily 1x SPIKES Futures ETF (NYSE:SPKX).
SPKX is a fund that tracks the SPIKES Futures Short-Term Index and measures volatility in broad-based equities in a similar way to ProShares Ultra VIX Short Term Futures ETF (NYSE:UVXY), which tracks the movement of the S&P 500 VIX Short-Term Futures Index.
Want direct analysis? Find me in the BZ Pro lounge! Click here for a free trial.
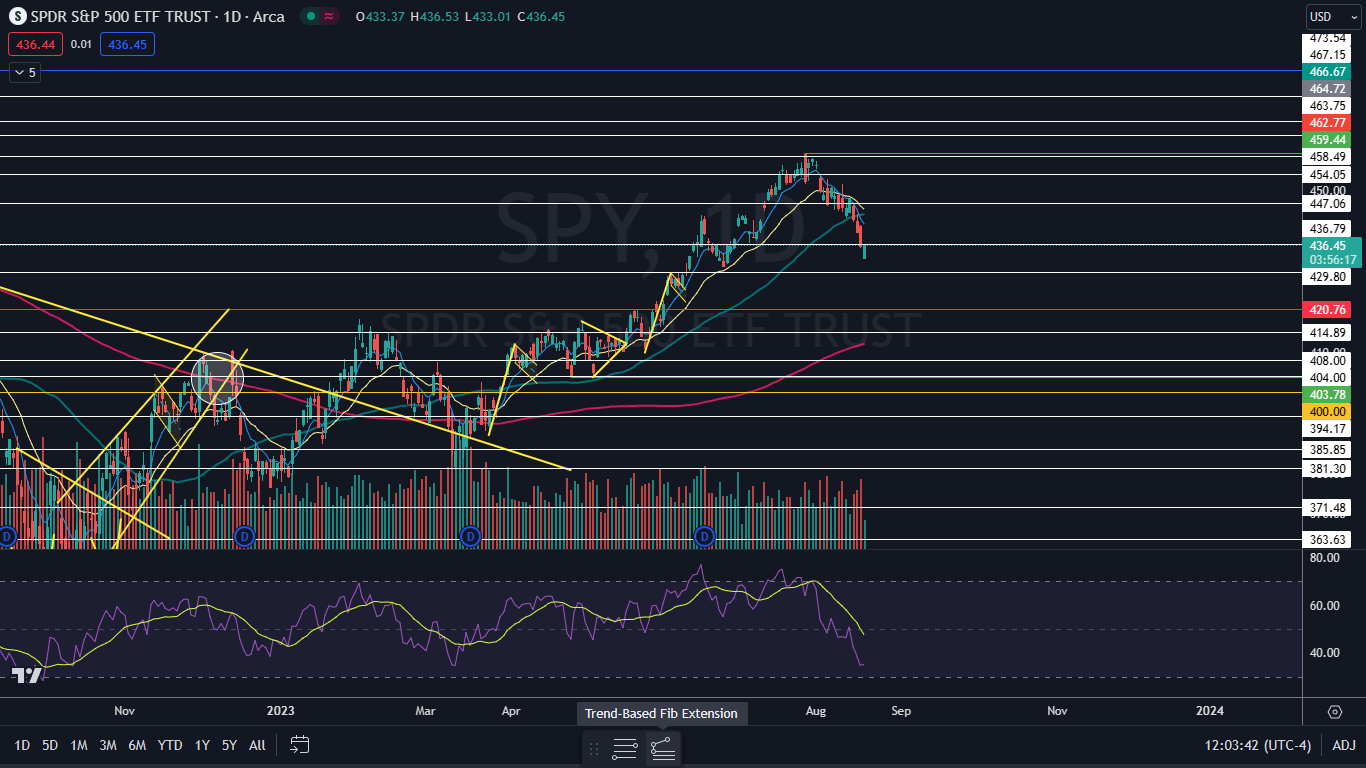
The SPY Chart: After gapping down to open Friday’s trading session, bulls came in to buy the dip, causing the SPY to jump to near flat. If the SPY closes the trading session near its high-of-day, the ETF will print a bullish Marubozu candlestick, which could indicate the local bottom has occurred and the stock market will pop higher on Monday.
- The SPY is trading in a downtrend, making a series of lower highs and lower lows. The most recent lower high was formed on Aug. 14 at $448.11 and the most recent confirmed lower low was printed at the $443.35 mark the day prior.
- Because the SPY hasn’t bounced since Aug. 14, a pop higher, at least to print another lower high, is a likely scenario. A short-term rebound is also likely on the horizon because the SPY’s relative strength index has plunged to about 35%, putting the ETF near oversold territory.
- Bulls want to see big bullish volume come in and drive the SPY back up above the 50-day simple moving average (SMA), which could indicate a longer-term rebound is on the horizon. Bears want to see the ETF form a lower high and then for the SPY to continue trending toward the lower 200-day SMA.
- The SPY has resistance above at $436.79 and at $447.06 and support below at $429.80 and at $414.89.
 Read Next: Alphabet (Google) Stock Slides In Tandem With Other FAANG Stocks As Investors' Fears Ticks Higher
Image sourced from Shutterstock
Posted In: SPKX SPY UVXY