Empowering Shareholders with Growth: PCB Bancorp Enhances Performance and Reports Rising Profits
Author: Benzinga Insights | August 18, 2023 11:05am
At the end of August 18, 2023, PCB Bancorp (NASDAQ:PCB) will reward its shareholders with a dividend payout of $0.18 per share, demonstrating an annualized dividend yield of 4.32%. Remember, only investors who held the stock before the ex-dividend date on August 10, 2023 will receive this payout.
PCB Bancorp Recent Dividend Payouts
| Ex-Date |
Payments per year |
Dividend |
Yield |
Announced |
Record |
Payable |
| 2023-08-10 |
4 |
$0.18 |
4.32% |
2023-07-27 |
2023-08-11 |
2023-08-18 |
| 2023-05-11 |
4 |
$0.18 |
5.41% |
2023-04-27 |
2023-05-12 |
2023-05-19 |
| 2023-02-09 |
4 |
$0.15 |
3.27% |
2023-01-26 |
2023-02-10 |
2023-02-17 |
| 2022-11-09 |
4 |
$0.15 |
3.03% |
2022-10-27 |
2022-11-10 |
2022-11-18 |
| 2022-08-11 |
4 |
$0.15 |
3.16% |
2022-07-28 |
2022-08-12 |
2022-08-19 |
| 2022-05-12 |
4 |
$0.15 |
2.88% |
2022-04-28 |
2022-05-13 |
2022-05-20 |
| 2022-02-10 |
4 |
$0.15 |
2.62% |
2022-01-27 |
2022-02-11 |
2022-02-18 |
| 2021-11-10 |
4 |
$0.12 |
2.38% |
2021-10-28 |
2021-11-12 |
2021-11-19 |
| 2021-08-05 |
4 |
$0.12 |
2.97% |
2021-07-22 |
2021-08-06 |
2021-08-13 |
| 2021-05-06 |
4 |
$0.1 |
2.79% |
2021-04-22 |
2021-05-07 |
2021-05-14 |
| 2021-02-09 |
4 |
$0.1 |
3.27% |
2021-01-28 |
2021-02-10 |
2021-02-19 |
| 2020-11-03 |
4 |
$0.1 |
4.29% |
2020-10-22 |
2020-11-04 |
2020-11-13 |
PCB Bancorp's dividend yield falls in the middle range when compared to its industry peers, with BCB Bancorp (NASDAQ:BCBP) having the highest annualized dividend yield at 5.49%.
Analyzing PCB Bancorp Financial Health
Companies that pay out steady cash dividends are attractive to income-seeking investors, and companies that are financially healthy tend to maintain their dividend payout schedule. For this reason, investors can find it insightful to see if a company has been increasing or decreasing their dividend payout schedule and if their earnings are growing.
YoY Growth in Dividend Per Share
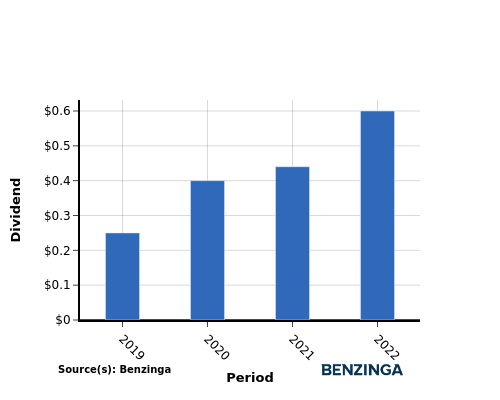
Investors witnessed an upward trajectory in the company's dividend per share between 2019 and 2022. The dividend per share rose from $0.25 to $0.60, indicating the company's dedication to enhancing shareholder value through increased dividends.
YoY Earnings Growth For PCB Bancorp
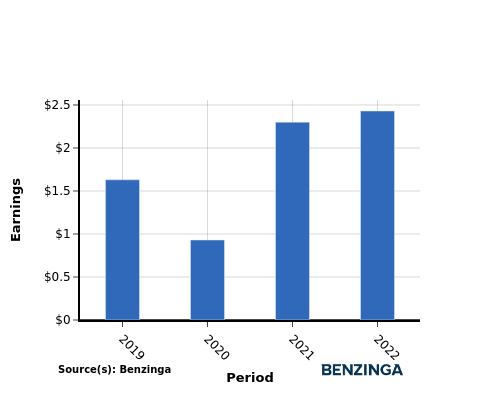
The earnings chart above shows that from 2019 to 2022, PCB Bancorp has experienced an increase in their earnings from $1.63 per share to $2.43 per share. This positive earnings trend is promising for income-seeking investors as it suggests that the company has more potential to increase its cash dividend payout if the trend continues.
Recap
This article delves into the recent dividend payout of PCB Bancorp and its implications for shareholders. Presently, the company is distributing a dividend of $0.18 per share, leading to an annualized dividend yield of 4.32%.
PCB Bancorp's dividend yield falls in the middle range when compared to its industry peers, with BCB Bancorp having the highest annualized dividend yield at 5.49%.
Considering the increase in dividend per share from 2019 to 2022 along with an increase in earnings per share, PCB Bancorp appears to be in a strong financial position, indicating their ability to sustain dividend distributions to investors.
Investors are encouraged to closely track the company's performance in the upcoming quarters to stay informed of any updates in financials or dividend disbursements.
\To keep track of which companies are distributing dividends, click here to visit our Dividends Calendar.
This article was generated by Benzinga's automated content engine and reviewed by an editor.
Posted In: BCBP PCB


