Bitcoin Plunges, Stock Market Volatility Rises: What's Happening And How To Play The Move
Author: Melanie Schaffer | August 18, 2023 07:08am
While the stock market tumbled Thursday, demonstrated by the S&P 500 closing down 0.77%, Bitcoin took a major hit, closing that 24-hour trading session 7.15% lower, amid increased worry the Federal Reserve will continue its rate hike campaign into the end of the year.
Consequently, volatility in the stock market rose, with the Volatility S&P 500 Index shooting up 6.74% Thursday to close at 17.90.
Fractures in the general market started to appear earlier this week, when major indices lost significant support levels. This caused the ConvexityShares Daily 1.5x SPIKES Futures ETF (NYSE:SPKY) to spike higher, which Benzinga said was likely to happen on Thursday.
SPKY is a 1.5x leveraged fund, which tracks the SPIKES Futures Short-Term Index and measures volatility in broad-based equities in a similar way to ProShares Ultra VIX Short Term Futures ETF (NYSE:UVXY), which tracks the movement of the S&P 500 VIX Short-Term Futures Index.
For every 1% daily movement in the SPIKES Futures Short-Term Index, the SPKY fund seeks to move 1.5%, meaning that it’s for short-term trades and should not be held for a long period of time.
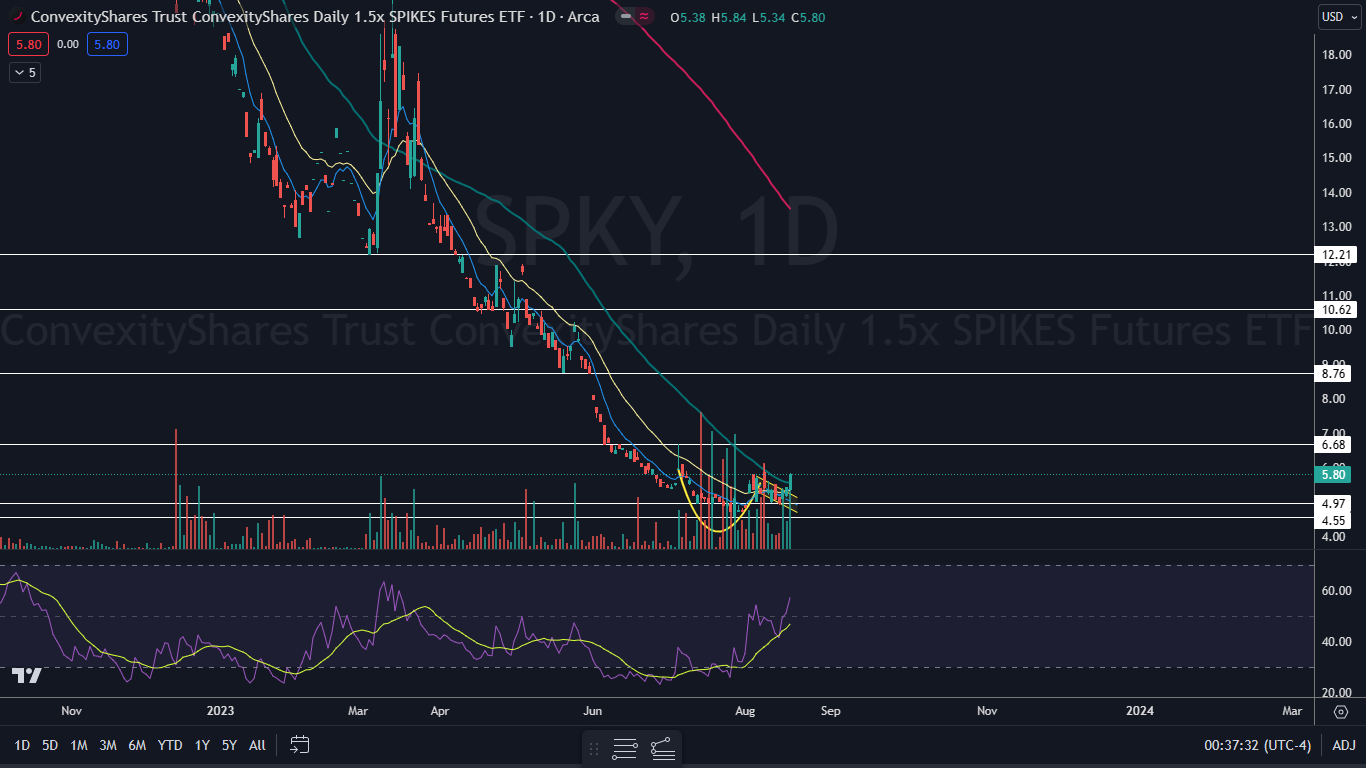
The SPKY Chart: SPKY broke up clearly from a cup-and-handle formation during the last half of Thursday’s session, on higher-than-average volume, which indicated the pattern was recognized. At the end of Thursday’s trading day, 16,690 shares of the ETF were exchanged compared to the 10-day average of 9,170.
- The move higher caused SPKY to negate the downtrend that was occurring within the downward-sloping handle of the cup-and-handle pattern. For a new uptrend to be confirmed, SPKY will eventually need to form a higher low above $4.91, which may provide traders who are bullish on volatility a solid entry point.
- On Thursday, SPKY formed a bullish Marubozu candlestick, which indicates higher prices may come on Friday. The second most likely scenario is that the ETF forms an inside bar pattern to consolidate the recent uptick in both price and volume.
- Thursday’s spike also caused SPKY to regain the 50-day simple moving average as support, which suggests the ETF may be entering at least a short-term bull cycle. When SPKY eventually retraces, the ETF may find support and reverse from that level.
- SPKY has resistance above at $6.68 and at $8.87 and support below at $4.97 and at $4.55.
 Read Next: This Fund Gained Almost 85% So Far This Year - The Best Volatility ETFs Of 2023
Image sourced from Shutterstock
Posted In: $BTC SPKY UVXY