Stock Market Volatility Jumps Following Fed Monthly Minutes: This ETF Offers 1.5X Leverage
Author: Melanie Schaffer | August 17, 2023 12:56pm
Volatility in the stock market was increasing on Thursday due to major stock indices breaking down through the 50-day moving average, which is a critical support level.
The Convexity Daily 1.5x SPIKES Futures ETF (NYSE:SPKY), which tracks volatility in the stock market, was rising slightly in reaction to the bearish movement across stocks, causing the ETF to negate its downtrend.
SPKY is a 1.5x leveraged fund that follows the SPIKES Futures Short-Term Index, measuring volatility in broad-based equities similar to the ProShares Ultra VIX Short Term Futures ETF (UVXY), which tracks the S&P 500 VIX Short-Term Futures Index.
With SPKY seeking to move 1.5% for every 1% daily movement in the SPIKES Futures Short-Term Index, it is intended for short-term trades and not recommended for long-term holdings.
With the S&P 500 breaking down through support, which is a warning sign that a longer-term correction could be on the horizon, volatility could continue to increase. The Federal Reserve’s monthly minutes also revealed further monetary tightening could be on the horizon, which could add further downside pressure to the stock market.
Want direct analysis? Find me in the BZ Pro lounge! Click here for a free trial.
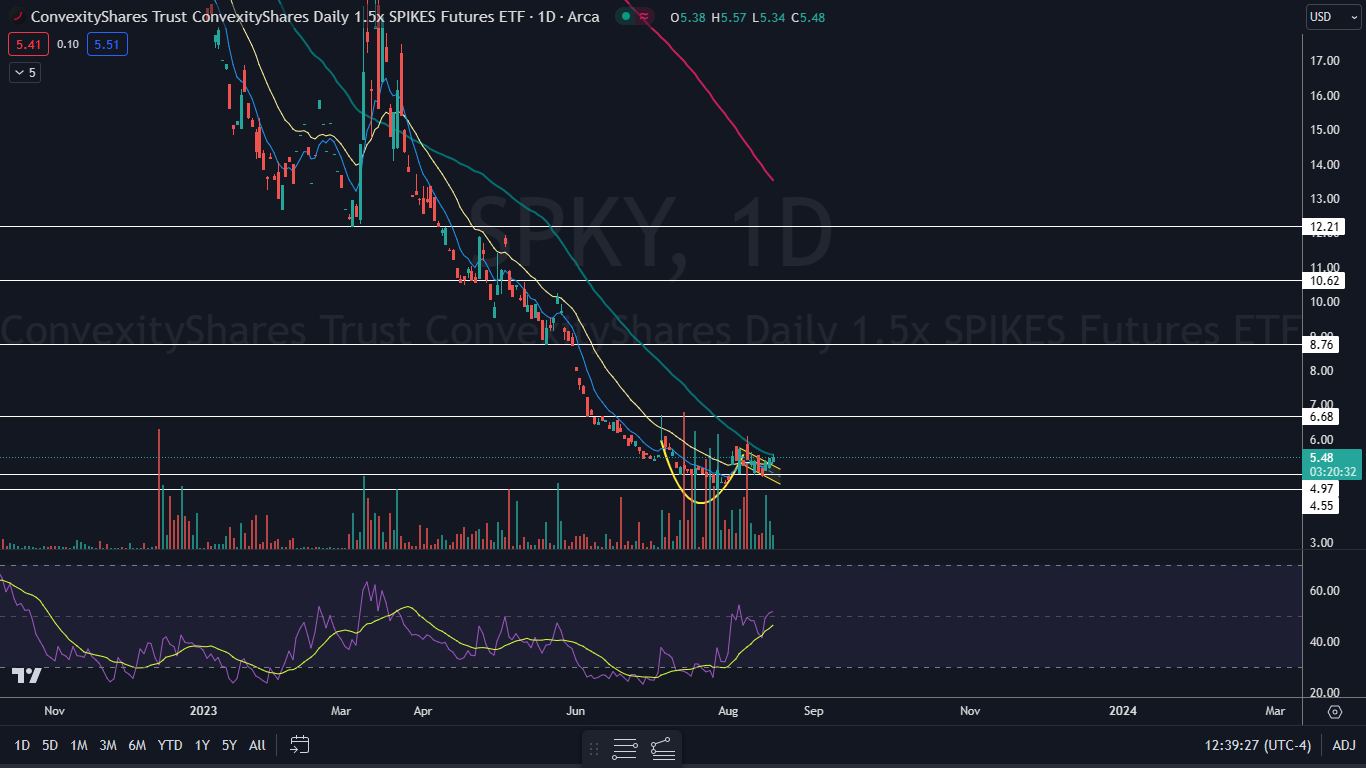
The SPKY Chart: SPKY popped up above the Aug. 11 high of $5.53 on Thursday, which negated the downtrend with a formation of a higher high. For a new uptrend to confirm, SPKY will eventually need to retrace lower to form a higher low above $4.91.
- Since July 6, SPKY has been forming a possible cup-and-handle pattern on the daily chart, with the cup formed between that date and Aug. 4 and the handle forming since. On Wednesday, the ETF broke up from the downward-sloping handle but on lower-than-average volume, which could indicate the pattern isn’t currently recognized.
- The low volume may be due to overhead resistance at the 50-day simple moving average, which technical traders expect to act as a barrier at least temporarily. If SPKY continues to consolidate under the area on decreasing volume, it could signal that the ETF is preparing to break up through the 50-day SMA, which could indicate a longer-term bull cycle is in the cards.
- SPKY has resistance above at $6.68 and at $8.76 and support below at $4.97 and at $4.55.
 Read Next: US Treasury Yields Hit Highest In Over 10 Years: Ackman Scores Early Win Over Buffett
Image sourced from Shutterstock
Posted In: SPKY UVXY