Is Nvidia Stock Headed Back Toward All-Time Highs? Here's What The Chart Indicates Ahead Of Fed Minutes
Author: Melanie Schaffer | August 16, 2023 10:21am
Nvidia Corporation (NASDAQ:NVDA) was trading near flat on Wednesday, continuing to consolidate Monday’s surge, which saw the stock close that trading session up 8.66%.
The move higher was in tandem with the S&P 500, which was trading flat on below-average volume ahead of the release of the Federal Reserve’s July minutes, which will provide investors with clues on whether the central bank’s plans to continue its rate hike campaign into the end of the year.
Once the minutes are issued, volatility in the stock market is likely to increase, especially if the reaction to the news is negative. Traders wishing to trade the potential volatility have multiple options, including the ConvexityShares Daily 1.5x SPIKES Futures ETF (NYSE:SPKY).
SPKY is a 1.5x leveraged fund, which tracks the SPIKES Futures Short-Term Index and measures volatility in broad-based equities in a similar way to ProShares Ultra VIX Short Term Futures ETF (NYSE:UVXY), which tracks the movement of the S&P 500 VIX Short-Term Futures Index.
For every 1% daily movement in the SPIKES Futures Short-Term Index, the SPKY fund seeks to move 1.5%, meaning that it’s for short-term trades and should not be held for a long period of time.
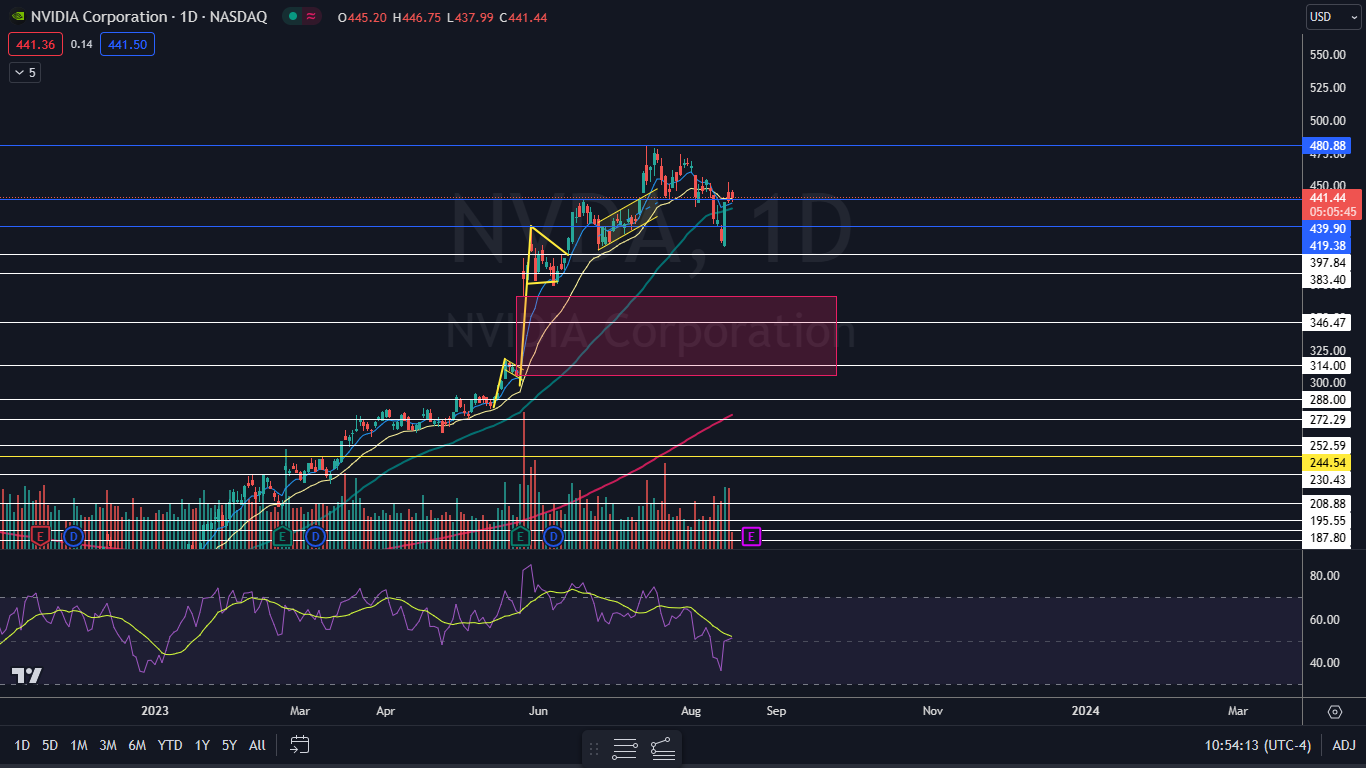
As for Nvidia, the stock has settled into a possible bull flag pattern on the daily chart. If the pattern is recognized, the multinational technology company could be headed back toward all-time highs.
Want direct analysis? Find me in the BZ Pro lounge! Click here for a free trial.
The Nvidia Chart: Nivida’s bull flat started to form on Monday, with the upwards pole created on that day and the downward sloping flag printing on Monday and Tuesday. If the pattern is recognized, the measured move is just under 9%, which suggests the stock could be headed back toward the $480 level.
- Although Nvidia looks to be forming a bull flag, the stock remains in a downtrend, which began on July 17. The most recent lower high was formed on Aug. 4 at $456.42 and the most recent lower low was printed at the $403.11 mark on Monday.
- If Nvidia suffers a bearish reaction to the Fed’s minutes and falls under $403, Tuesday’s high-of-day will serve as the next lower high within the pattern, the bull flag will be negated and the downtrend will continue. If the stock breaks up from the bull flag pattern, however, the downtrend will be negated and a new uptrend may be in the cards.
- Nvidia has resistance above at $480.88 and at the psychologically important $500 level and support below at $439.90 and at $419.38.
 Read Next: This Fund Gained Almost 85% So Far This Year - The Best Volatility ETFs Of 2023
Image sourced from Shutterstock
Posted In: NVDA SPKY UVXY


