Stock Market Slumps, Volatility Spikes Following Better-than-Expected Retail Sales: This Fund Offers 1.5X Returns
Author: Melanie Schaffer | August 15, 2023 11:50am
The SPDR S&P 500 (NYSE:SPY) was falling about 0.8%s during Tuesday’s trading session, while the CBOE Volatility Index (CBOE: VIX) was spiking over 8% at one point amid a retail-heavy earnings week that was preceded by stronger-than-expected retail sales numbers released by the U.S. Census Bureau Tuesday morning.
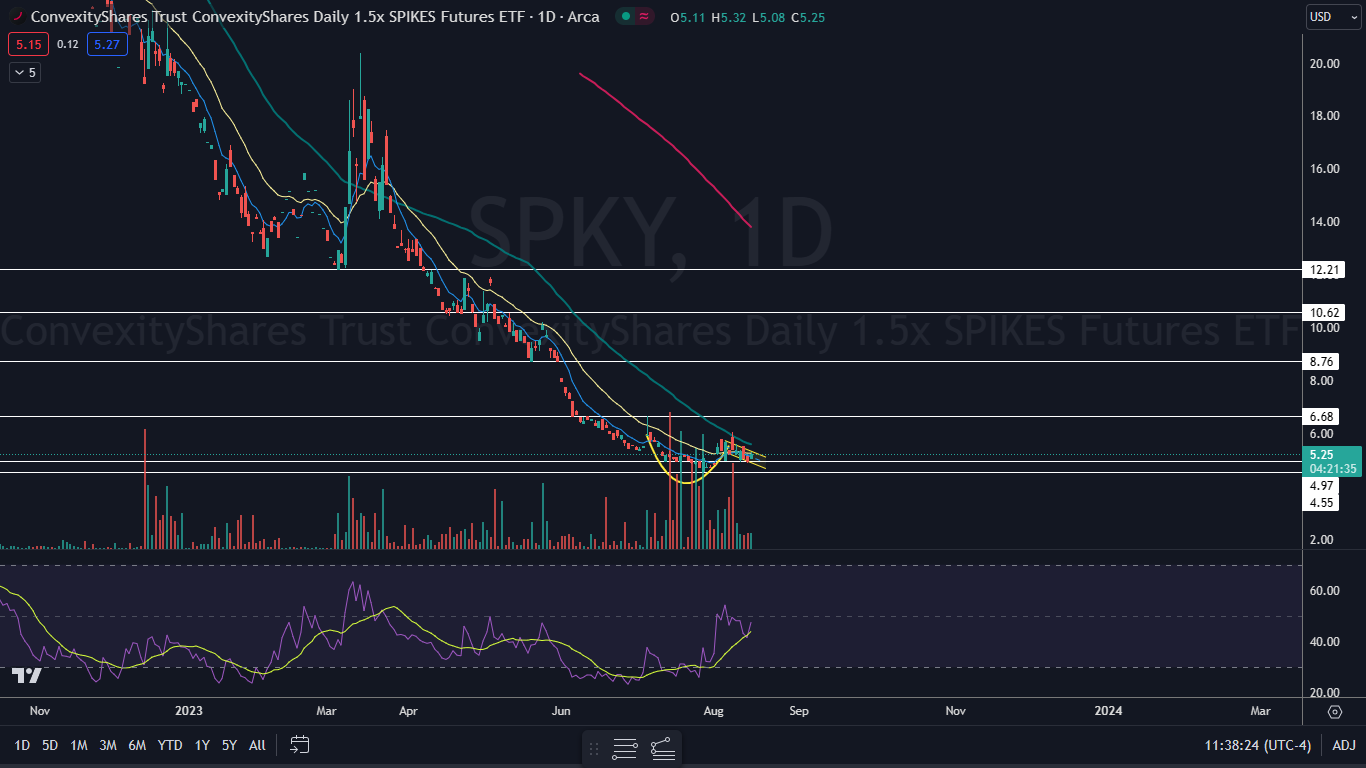
ConvexityShares Daily 1.5x SPIKES Futures ETF (NYSE:SPKY) was trading about 6% higher, attempting to hold above the eight-day exponential moving average, while trading in a possible cup-and-handle pattern.
SPKY is a 1.5x leveraged fund, which tracks the SPIKES Futures Short-Term Index and measures volatility in broad-based equities in a similar way to ProShares Ultra VIX Short Term Futures ETF (NYSE:UVXY), which tracks the movement of the S&P 500 VIX Short-Term Futures Index.
For every 1% daily movement in the SPIKES Futures Short-Term Index, the SPKY fund seeks to move 1.5%, meaning that it's for short-term trades and should not be held for a long period of time.
It should be noted SPKY is a short-term trading vehicle and positions in the ETF shouldn't be held for long periods of time.
Want direct analysis? Find me in the BZ Pro lounge! Click here for a free trial.
The SPKY Chart: SPKY started to trade in a possible cup-and-handle pattern on July 6, with the rounded cup formed between that date and Aug. 3 and the downward-sloping handle printing since. The pattern is a bullish reversal formation that is often found at the bottom of a downtrend.
- Bullish traders want to see the ETF break up from the upper descending trend line of the handle on big bullish volume, which could indicate the short-term downtrend within the latter part of the pattern will end and a strong uptrend could be on the horizon. Bearish traders want to see SPKY continue to reject the top trend line of the handle, which could continue to drag the ETF lower until the cup-and-handle is negated near the $4.75 mark.
- SPKY has resistance above at $6.68 and at $8.76 and support below at $4.97 and at $4.55.
 Read Next: China's Central Bank Takes Surprising Step As Economy Falters: Why Americans Should Care
Featured image sourced from Shutterstock
Posted In: SPKY SPY UVXY