Stock Market Muted Following Moody's Downgrades, Ahead Of Critical Inflation Report: If Volatility Spikes, This Fund Offers Leverage
Author: Melanie Schaffer | August 09, 2023 10:48am
The SPDR S&P 500 (NYSE:SPY) was trading mostly flat Wednesday, ahead of key July inflation data, set to be released by the Bureau of Labor Statistics before the stock market opens Thursday.
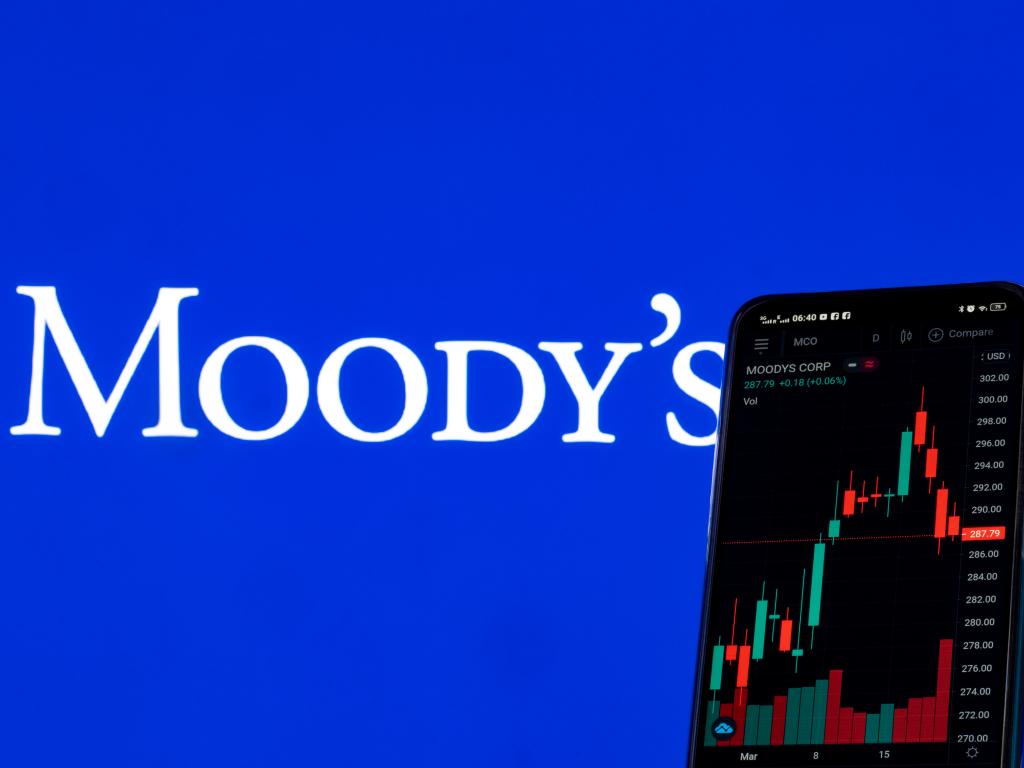
The muted price action across the stock market comes after volatile price action on Tuesday, which was driven by banking-sector worries after credit rating organization Moody’s downgraded 10 U.S. small and mid-sized banks. Read more here...
U.S. consumer price index (CPI) data will be crucial for the market Thursday, providing clues as to whether the Federal Reserve will continue hiking interest rates when it meets next in September.
If CPI data comes in higher-than-expected, volatility in the stock market may increase as investors price in further interest rate raises. If that happens, traders may choose to play a potential volatility upswing through the Convexity Daily 1.5x SPIKES Futures ETF (NYSE:SPKY).
SPKY is a 1.5x leveraged fund that follows the SPIKES Futures Short-Term Index, measuring volatility in broad-based equities similar to the ProShares Ultra VIX Short Term Futures ETF (UVXY), which tracks the S&P 500 VIX Short-Term Futures Index.
Want direct analysis? Find me in the BZ Pro lounge! Click here for a free trial.
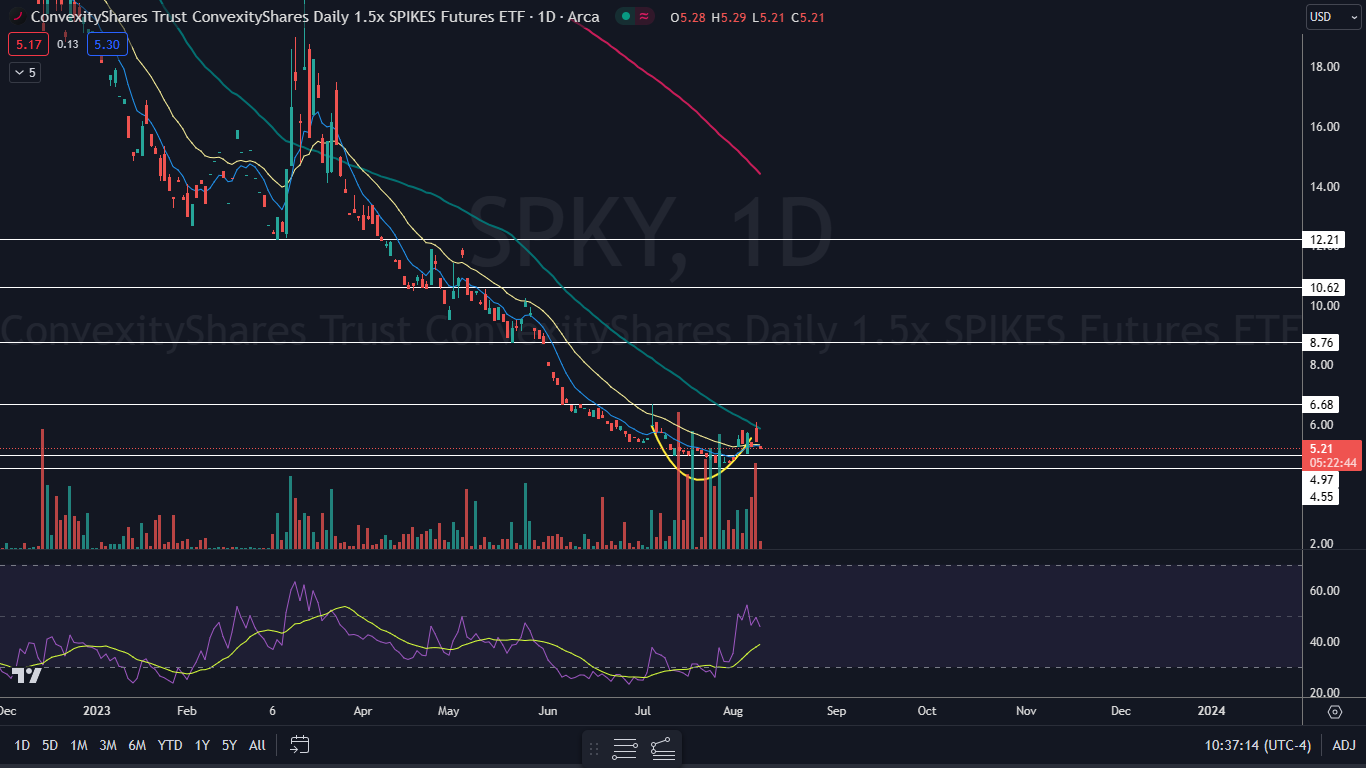
The SPKY Chart: SPKY was dropping over 4% on Wednesday after gapping down slightly to start the trading session. The move lower followed a volatile day on Tuesday, which saw the ETF surge almost 12% before falling to close near flat.
- SPKY is trading in an uptrend, making a series of higher highs and higher lows. The most recent higher high was formed on Tuesday at $6.09 and the most recent higher low was printed at the $5 mark on Friday.
- Bullish traders looking to enter a position may choose to wait for SPKY to form a bullish reversal candlestick, such as a doji or hammer candlestick, above $5, which could indicate the local bottom has occurred and the ETF will rise to continue its uptrend. If the ETF forms a lower low, the uptrend will be negated and traders will want to watch for another bullish signal to develop.
- SPKY has resistance above at $6.68 and at $8.76 and support below at $4.97 and at $4.55.
 Read Next: Mortgage Mayhem: Rates Reach Highest Point Since 2002, Rocking Real Estate Market
Featured image sourced from Shutterstock
Posted In: SPKY SPY