Looking To Play A Potential Volatility Spike Ahead Of Big Earnings? This ETF Offers 1.5X Leverage
Author: Melanie Schaffer | August 03, 2023 01:25pm
The SPDR S&P 500 (NYSE:SPY) gapped down to open Thursday's trading session, while the CBOE Volatility Index (CBOE: VIX) surged over 10% higher at one point, ahead of Apple, Inc and Amazon.com, Increporting quarterly earnings.
ConvexityShares Daily 1.5x SPIKES Futures ETF (NYSE:SPKY) was trading over 3% higher but on low volume after closing Wednesday's session up 14%.
SPKY is a 1.5x leveraged fund, which tracks the SPIKES Futures Short-Term Index and measures volatility in broad-based equities in a similar way to ProShares Ultra VIX Short Term Futures ETF (NYSE:UVXY), which tracks the movement of the S&P 500 VIX Short-Term Futures Index.
For every 1% daily movement in the SPIKES Futures Short-Term Index, the SPKY fund seeks to move 1.5%, meaning that it's for short-term trades and should not be held for a long period of time.
It should be noted SPKY is a short-term trading vehicle and positions in the ETF shouldn't be held for long periods of time.
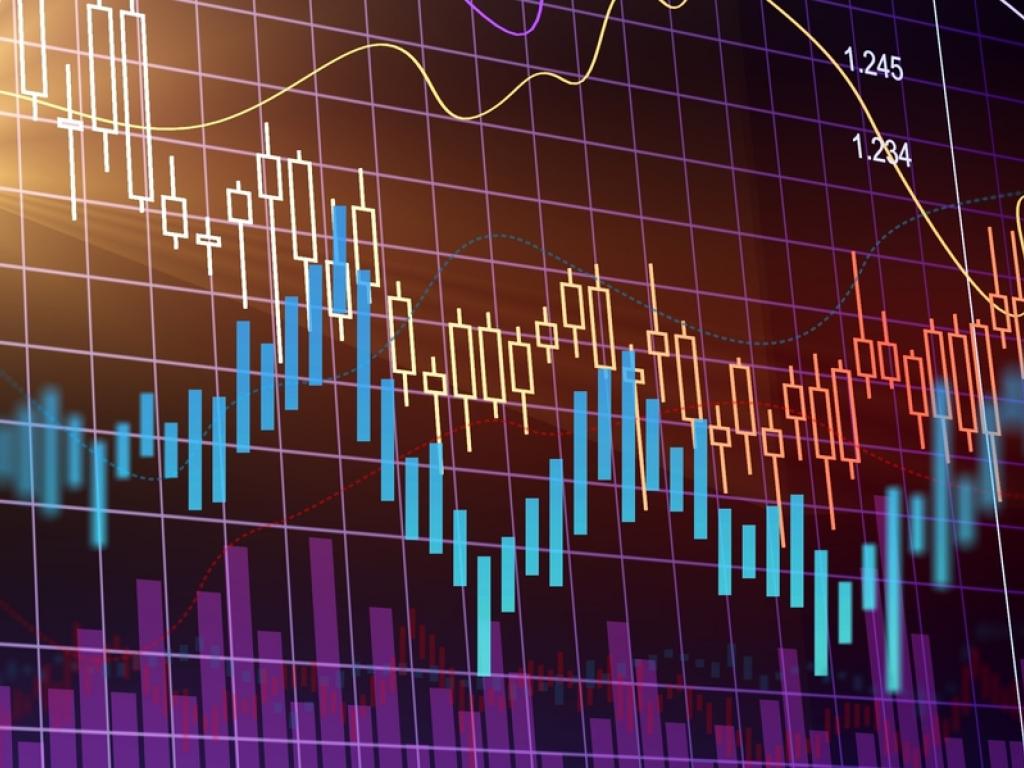
The SPKY Chart: After trading in a steep downtrend since March 16, SPKY reached a bottom of $4.55 on July 19, where the ETF started to trade sideways but on increasing volume. That increase indicated traders were taking an interest and positioning themself in the ETF and on Wednesday, SPKY spiked higher to negate its downtrend.
For a new uptrend to confirm, SPKY will need to eventually form a higher low above the most recent low of $4.55. The retracement to the downside may come over the next few days because on Thursday, the ETF was working to print a bearish Marubozu candlestick, which may indicate the local top has occurred.
Traders bullish on volatility want to see SPKY eventually form a bullish reversal candlestick, such as a doji or hammer candlestick, which could then indicate the next bottom has occurred and the ETF will form an uptrend. Traders may be sitting on the sidelines to see how the stock market reacts to Apple and Amazon's earnings prior to taking a position.
SPKY has resistance above at $6.68 and at $8.76 and support below at $4.97 and at $4.55.