Interest In Amazon Decreases Ahead Of Earnings Print: A Technical Analysis
Author: Melanie Schaffer | July 31, 2023 02:37pm
Amazon.com, Inc (NASDAQ:AMZN) was trading slightly higher Monday, ahead of its second-quarter earnings print, which is set to be released on Thursday.
Investors will be particularly interested in how the Amazon Web Services arm of its business is faring, after Microsoft and Google reported slowed growth in their cloud businesses on July 25.
Heading into the event, Amazon negated its downtrend but hasn’t yet confirmed a new uptrend by forming a higher low.
If Amazon receives a bearish reaction to its earnings print and falls back into a downtrend, volatility in the stock market could increase due to how heavily weighted the stock is within the S&P 500.
Traders wishing to trade the potential volatility have multiple options, including the ConvexityShares Daily 1.5x SPIKES Futures ETF (NYSE:SPKY).
SPKY is a 1.5x leveraged fund, which tracks the SPIKES Futures Short-Term Index and measures volatility in broad-based equities in a similar way to ProShares Ultra VIX Short Term Futures ETF (NYSE:UVXY), which tracks the movement of the S&P 500 VIX Short-Term Futures Index.
For every 1% daily movement in the SPIKES Futures Short-Term Index, the SPKY fund seeks to move 1.5%, meaning that it’s for short-term trades and should not be held for a long period of time.
Want direct analysis? Find me in the BZ Pro lounge! Click here for a free trial.
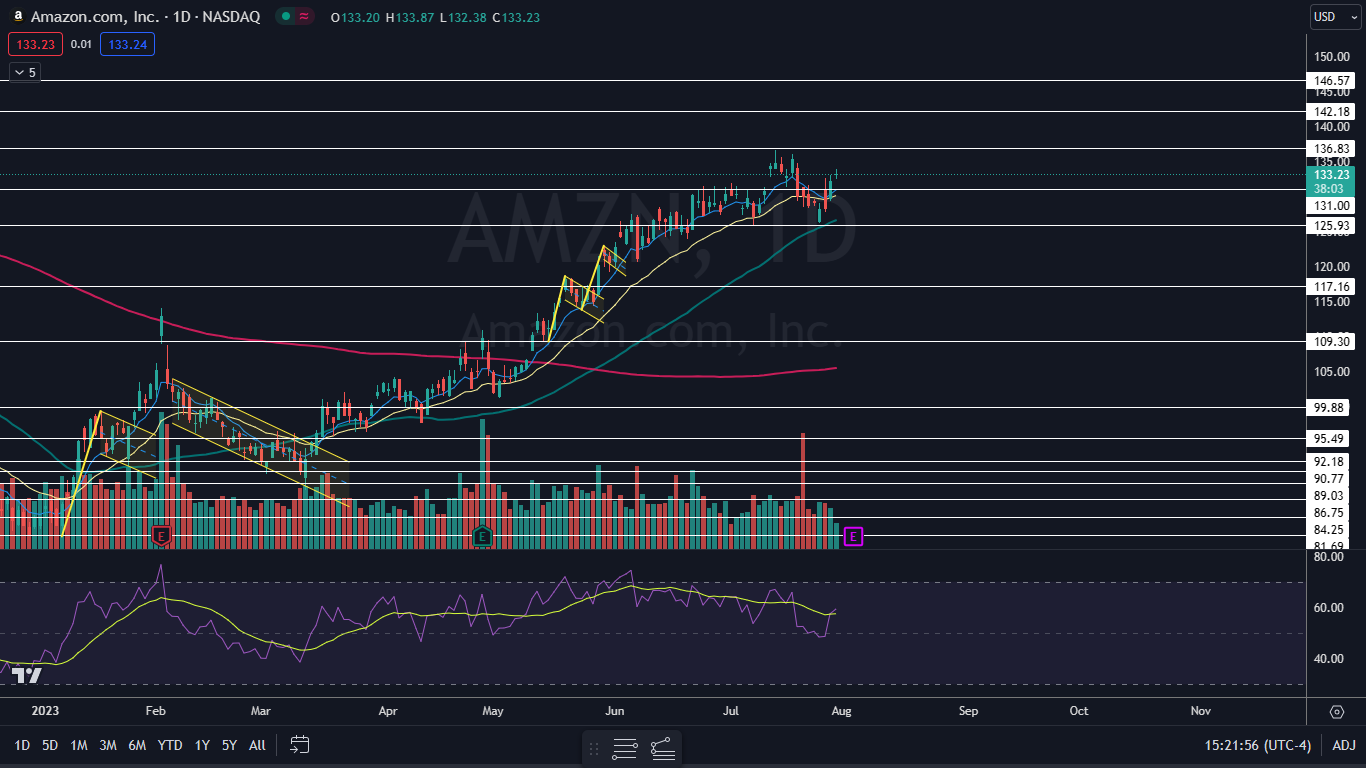
The Amazon Chart: Amazon negated its downtrend on July 27 by forming a higher high above the most recent lower high, printed on July 24 at $131.66. On Monday, Amazon was looking to print a doji candlestick, which could indicate the local top has occurred and the stock will retrace heading into its earnings print.
- If Amazon retraces but rebounds above $126.11, a higher low will form and an uptrend will be confirmed. If the stock falls under that area, the recent upturn will serve as a bull trap and the downtrend will resume.
- Although Amazon has climbed higher since July 26, the move has been taking place on decreasing volume, which indicates the bulls are running out of steam. The stock’s volume could continue to decrease ahead of the earnings print, after which traders can watch for big volume to come in and break the stock to a new high or to a more significant low.
- Amazon has resistance above at $136.83 and at $142.18 and support below at $131 and at $125.93.
Read More: US Stocks Take A Breather, Nasdaq Notches Fifth Straight Month Of Gains: Investors Gear Up For Pivotal Week
Posted In: AMZN SPKY UVXY