Volatility Pops As Stock Market Trades Muted Ahead Of Big Earnings Week: This Fund Offers 1.5X Leverage
Author: Melanie Schaffer | July 31, 2023 10:40am
The SPDR S&P 500 (NYSE:SPY) was trading relatively flat Monday, while the the CBOE Volatility Index (CBOE: VIX) was popping up about 4.5% higher ahead of another big earnings week, which will see Advanced Micro Devices, Inc, Apple, Inc and Amazon.com, Inc print quarterly earnings.
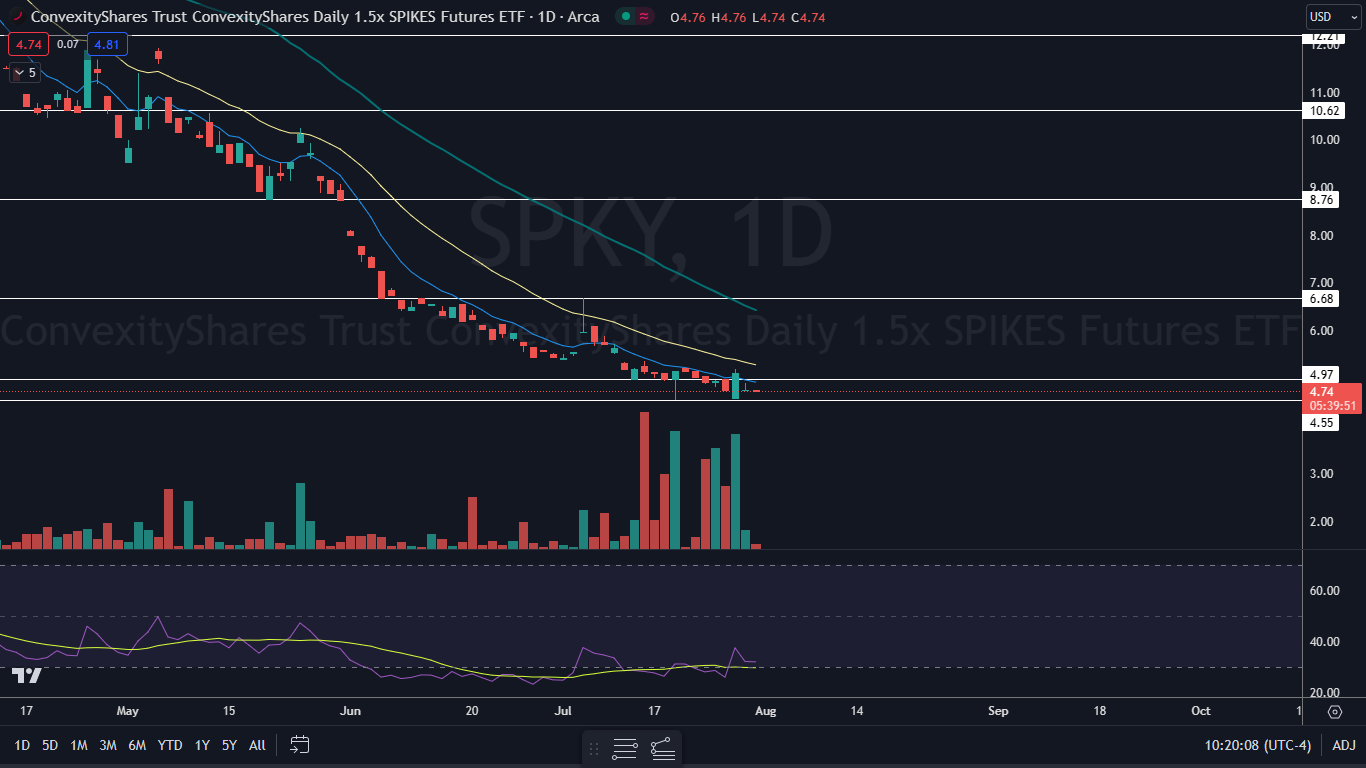
ConvexityShares Daily 1.5x SPIKES Futures ETF (NYSE:SPKY) was trading flat heading into the week, printing a double inside bar pattern to consolidate Thursday’s 11.2% surge.
SPKY is a 1.5x leveraged fund, which tracks the SPIKES Futures Short-Term Index and measures volatility in broad-based equities in a similar way to ProShares Ultra VIX Short Term Futures ETF (NYSE:UVXY), which tracks the movement of the S&P 500 VIX Short-Term Futures Index.
For every 1% daily movement in the SPIKES Futures Short-Term Index, the SPKY fund seeks to move 1.5%, meaning that it’s for short-term trades and should not be held for a long period of time.
Want direct analysis? Find me in the BZ Pro lounge! Click here for a free trial.
The SPKY Chart: SPKY’s double inside bar pattern leans bullish, because the ETF was trading higher prior to forming the pattern. Traders and investors can watch for SPKY to eventually break up or down from Thursday’s mother bar, on higher-than-average volume, to gauge future direction.
- The ETF has been trading on decreasing volume, which indicates traders are currently sitting on the sidelines. Decreasing volume is usually followed by a large increase in volume, which will eventually determine the ETF’s trend over the short term.
- SPKY negated its downtrend on Thursday, by printing a higher high above the most recent lower high, which was formed on Wednesday at $4.98. For a new uptrend to confirm, SPKY will need to form either a higher low or another higher high.
- If the ETF breaks down under $4.55, a downtrend is likely to resume and SPKY will reach new all-time lows.
- SPKY has resistance above at $4.97 and at $6.68 and support below at $4.55 and the psychologically important $4 mark.
Read More: US Stocks Brace For Sluggish Start To Fresh Week: Analyst Explains Why Current Bull Market Rally Is Sustainable
Posted In: SPKY SPY UVXY