Hedge Funds Fall Short: Underperforming Low-Cost S&P 500 ETF By 6% In 2023. Here's Why.
Author: Piero Cingari | April 20, 2023 05:27pm
So far, 2023 has not started well for the hedge fund sector, as a common SPDR S&P 500 Trust ETF (NYSE:SPY) fared much better than the Global X Guru Index ETF (NYSE:GURU), a fund that invests in the highest conviction ideas from a chosen pool of hedge funds.
As of this writing, GURU has underperformed the SPY ETF by 6% year-to-date, not exactly the type of result an investor would have expected from a fund costing eight times more than the largest ETF based on the S&P 500.
GURU shows a 0.75% expense ratio compared to only 0.09% of the SPY.
Also Read: Jim Cramer Says Tesla's Cybertruck Is A 'Toy For Elon Musk Fanboys': Why The 'Ugliest Truck' He's 'Ever Seen' Is Going To Get Run Over By Ford
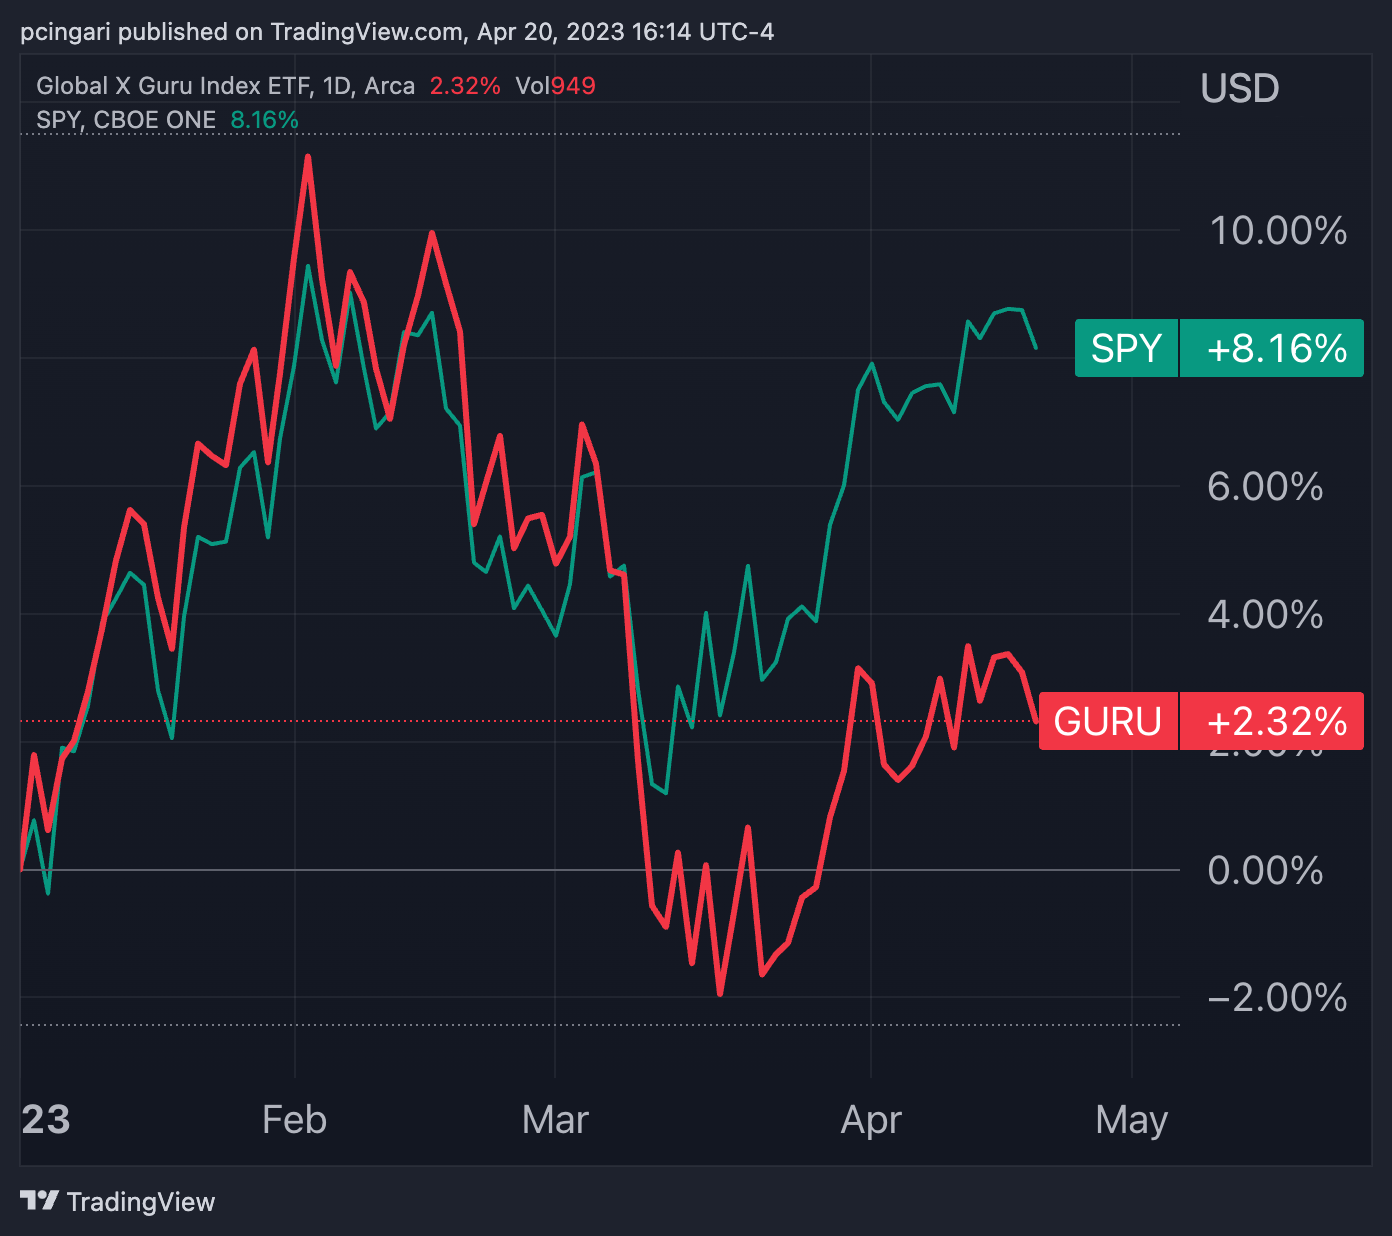
Year-to-date performance of SPY ETF and GURU ETF as of April 20, 2023 – Chart: TradingView
Why The Average Hedge Fund Underperformed The S&P 500 This Year
GURU's huge underweight on mega-cap firms appears to have been the key factor behind the underperformance versus the S&P 500.
Apple, Inc. (NASDAQ:AAPL), Amazon, Inc. (NASDAQ:AMZN), and Microsoft Corp. (NASDAQ:MSFT) are the three largest holdings in the SPY ETF with a 7%, 6%, and 3% weight, respectively, only have a 1.6% weight in the GURU's portfolio. The most representative stock in the GURU ETF is Seagen, Inc. (NASDAQ:SGEN) with a 2.5% weight.
JD.com, Inc. (NASDAQ:JD), Rivian Automotive, Inc. (NASDAQ:RIVN), and Ascendis Pharma A/S (NASDAQ:ASND) were the worst performers in the GURU portfolio, each losing a third of their value.
Moreover, the gap between SPY and GURU widened after mid-March, when the regional banking crisis started. It seems like hedge funds have broadly missed the latest rally of the broader U.S. stock market.
Read now: Benzinga's 'Stock Whisper' Index: 5 Stocks Investors Are Secretly Monitoring But Not Talking About Yet
Posted In: AAPL AMZN ASND GURU JD MSFT RIVN SGEN SPY